A Point And Line Graph
ADVERTISEMENT
 1
1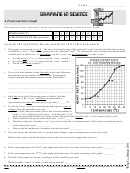 2
2NAME: __________________________
A Point and Line Graph
The numbers in the "data table" below were used to make the "point and line" graph.
AMOUNT OF EXERCISE (No. of Jumping Jacks)
0
5
10
15
20
25
30
35
40
45
50
AVERAGE HEART RATE (Beats per minute)
60
62
70
82
98
108 112
114
115
116
116
ANSWER THE QUESTIONS BELOW, BASED ON THIS CHART AND GRAPH:
1. This graph is constructed on a grid. The lower (horizontal) edge of this grid is the "x-axis" and the left-hand side (vertical)
is called the "y-axis". The numbers on each axis are called the "scale". To make up the scale, we had to first decide which
variable went on which axis; i.e. Heart Rate is on the "y-axis" and Amount of Exercise is on the "x-axis".
a.
On which axis did we plot the
"cause variable"? ____
b.
On which axis did we plot the
"result variable"? ____
c.
Which is the "cause variable"?
_______________________________
2. If you look at the numbers in the data table, what
is the difference between the way the numbers
increase for the "Amount of Exercise" compared
to how the numbers increase for the "Heart Rate"?
___________________________________
___________________________________
___________________________________
3. Each line on the grid of the graph paper is called a
"grid line".
For the scale on the "x-axis", how many jumping
jacks is represented by the space between any two
grid lines?______
4. To plot the "curve" (the line connecting the little
squares), pairs of numbers from the data table were used.
•
With a light, thin pencil mark, draw a line from the number 10 on the "x-axis" straight up to the curve. From the point
(little square with the arrow pointing at it) at which the pencil line hits the curve, draw another thin pencil line (parallel
to the "x-axis") across to the "y-axis".
a.
What number did the pencil mark reach at the "y-axis". _____.
b.
Therefore, what pair of numbers ("x/y") was used to make the "co-ordinate point" (little square) at which the pencil
marks meet at the curve? __________.
c.
What would be another pair of numbers from the data table? __________.
5. The curve shows how heart rate changes the more a person exercises.
Based on this graph, describe the change in the heart rate the more a person exercises.
___________________________________________________________________________________________________
6. If a person were to do 70 jumping jacks, what might his/her heart rate be, according to this graph? _________
7. The title of this graph was chosen according to which variables were used.
Which variable, "cause" or "result", comes first in the title? _______________
ADVERTISEMENT
0 votes
Related Articles
Related forms


Related Categories
Parent category: Miscellaneous