Math Practice Sheets Reading A Pie Graph
ADVERTISEMENT
 1
1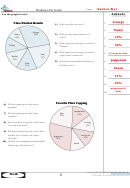 2
2Name:
Reading a Pie Graph
Use the graph to solve.
A n s w e r s
George
Class Election Results
1.
1) Who won the election?
Nancy
2.
George
2) Who got the least number of
Nancy
29%
12%
10%
votes?
3.
3) What percent of people voted for
34%
Tiffany
4.
Tiffany?
4) What percent of people voted for
George & Sam
5.
Sam
either Sam or Rachel?
Rachel
21%
13%
pepperoni
6.
5) Which two candidates had about
John
half the votes?
15%
bacon
7.
11%
8.
23%
9.
pepperoni &
ham
10.
Favorite Pizza Topping
6) Which topping was the most
popular?
mushrooms
7) Which topping was the least
ham
14%
22%
popular?
8) What percent of people said bacon
sausage
13%
was their favorite?
9) What percent of people said either
anchovies or bacon was their
anchovies
pepperoni
12%
favorite?
28%
10) Which two toppings did about half
bacon
the people like the best?
1-10 90 80 70 60 50 40 30 20 10 0
6
Math
ADVERTISEMENT
0 votes
Related Articles
Related forms


Related Categories
Parent category: Education