Math Practice Sheets Reading A Pie Graph
ADVERTISEMENT
 1
1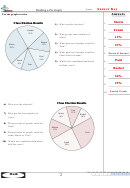 2
2Name:
Reading a Pie Graph
Use the graph to solve.
A n s w e r s
Maria
Class Election Results
1.
1) Who won the election?
Frank
Rachel
2.
21%
2) Who got the least number of
12%
votes?
3.
Bianca
3) What percent of people voted for
Maria
15%
23%
4.
Tom?
29%
4) What percent of people voted for
Maria & Rachel
5.
either Paul or Frank?
Paul
15%
Paul
Frank
6.
5) Which two candidates had about
8%
Tom
half the votes?
Rachel
7.
26%
8.
25%
9.
Paul & Frank
10.
Class Election Results
6) Who won the election?
Tom
11%
7) Who got the least number of
Maria
Rachel
14%
votes?
10%
8) What percent of people voted for
Paul?
Bianca
15%
9) What percent of people voted for
Paul
either Maria or Tom?
10) Which two candidates had about
Frank
half the votes?
24%
1-10 90 80 70 60 50 40 30 20 10 0
2
Math
ADVERTISEMENT
0 votes
Related Articles
Related forms


Related Categories
Parent category: Education