7th Grade Name I.2 Worksheet
ADVERTISEMENT
 1
1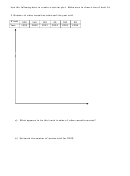 2
2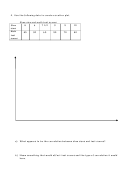 3
3th
7
grade
Name ____________________
I.2 Worksheet
Date ____________Period____
Scatter plots
1.
100
90
G
80
r
70
a
60
d
50
e
40
0
2
4
6
8
10
Number of Hours Studying
a) Draw a line of best fit.
b) Use your trend line to predict the grade of a student who spends 3 hours studying.
c)
Describe the correlation of the data.
2. Determine whether a scatter plot of the data for the following has a positive, negative
or no correlation.
a) outside temperature and the amount of heating bill
b) hair color and height
c) the number of songs on a CD and the cost of a CD
d) hours worked and earnings
ADVERTISEMENT
0 votes
Related Articles
Related forms


Related Categories
Parent category: Education