The Interaction Of Serum Albumins With Calcium Page 3
ADVERTISEMENT
 1
1 2
2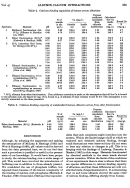 3
3 4
4ALBUMIN-CALCIUM INTERACTIONS
Table 2. Calcium-binding capacities of human serum albumins
Donnan
coefficient Calculated
N of
Ca (mg./l.)
calculated
free Ca
sample
,
from
inside
BoundCa
in sac
Outside
Inside
chloride
sac
N
Specimen
Material
pH
(g./l.)
sac
sac
distribution
(mg./l.)
(mg./g.)
1
Methanol fractionation (94-
6-64
2-33
138&4
150-9
1-01
139-9
4-7
97%)
(Piflemer
& Hutchin-
6-69
470
137-3
164-4
1-04
142-1
4-7
son, 1945)
2
Ether fractionation (85%)*
6-63
3-13
168-3
187'8
1-04
174-9
4-1
(Kekwick
& MacKay, 1949)
6*71
6-27
174-8
214-8
1-08
188-7
4.2
3
25% (American Red Cross,
5-86
11.0
124-4
135-9
1.09
135-6
Nil
for therapy) (95-97%)
6-35
11.0
123-1
132-0
1-07
131-9
Nil
6-41
11-0
123-1
132-0
1.08
132-9
Nil
7-16
11-0
124-1
133-0
1.08
134-0
Nil
7*24
11.0
123-1
133-0
1-08
132-9
Nil
7*41
11-0
125-0
134-0
1-07
134-8
Nil
7*50
11-0
125-0
134-0
1*07
134-8
Nil
7-77
11-0
122*1
131*2
1-08
132-0
Nil
7-84
11-0
127*2
136-1
1-08
137-4
Nil
4
Ethanol fractionation, 5 re-
6-80
3-83
134-9
156-5
1V03
139-3
4-5
crystallizations
(100%)
6-76
5 07
130-6
159-0
1-04
135-5
4-6
(Cohn et
al.
1946)
6-74
7 70
137-0
183-4
1-08
147-5
4-7
6*76
10-07
130*6
185-5
1*06
138-5
4-7
5
Ethanol fractionation, 10 re-
6-26
3*23
134-3
140-7
1-02
136-7
1-2
crystallizations (100%)
6-30
6-37
130-6
140-3
1F03
134-2
1.0
(Cohn
et al. 1946)
6-30
6-43
134-3
146-6
1-03
138-6
1F2
6-33
10-03
138-1
152-1
1-04
142-0
1.0
6
Ethanol fractionation; re-
6-79
4-67
138-9
185-6
1F03
142-7
9-2
crystallizations
as mercury
6-72
7.03
138-9
206-1
1X06
146-6
8X5
salt (100%) (Hughes, 1947)
* 85 % albumin from ether fractionation. If an arbitrary correction is made
on
the assumption that
all
the Ca is bound
to
the albumin only, the figure for mg. of Ca bound to g. of albumin N (last column) would be 4-8. This assumption is
not
strictly
warranted on the data
presented.
Table 3.
Calcium-binding capacity of substandard
human albumin serum from ether
fractionation
Donnan
coefficient
Calculated
N of
Ca
(mg./l.)
calculated
free Ca
sample
,
from
inside
Bound Ca
in sac
Outside
Inside
chloride
sac
N
Material
pH
(g./l.)
sac
sac
distribution
(mg./l.)
(mg./g).
Ether fractionation (90%) (Kekwick &
6-58
3-23
136-0
138-0
1-02
138-2
Nil
MacKay, 1949)
6-50
4X83
136-0
140-1
1-03
139-6
Nil
6-40
4-83
136*0
140-1
1*03
139-6
Nil
DISCUSSION
ables that such complexes might introduce into the
system. Within the limited range of
pH
at which
we
Although, by adopting the arguments and making
explored
and obtained calcium
binding, though
the assumptions of McLean & Hastings (1935) and
small fluctuations
were
observed
they
did
not
seem
Weir &
Hastings (1936), pK
values could be derived
to
bear
any
relation
to
changes
in
pH.
This is in
from the data presented here,
we
do
not
feel that
keeping with the findings of Ludewig, Chanutin
&
such
a
procedure is justified
or
useful
in the present
Masket (1942) in this
range.
Materials fractionated
state
of
our
knowledge. It would have been proper
by identical methods
in the
same
hands showed
to
study
the
calcium-binding
over a
wider
range
of
species
variation. Within the limits of the conditions
pH.
This would have involved the introduction of
of
our
experiments there
is clear evidence that there
buffering ions
in addition
to
those already present.
are
species
differences in
calcium-binding capacity
We considered the
use
of
phosphate buffers, but
of
albumins,
and that these differences
are
well out-
rejected
them because of the known
complexity
of
side the limits of
experimental
error.
It is
interesting
the binding of calcium with phosphates
(Marrack
&
that
ox
and horse albumin showed the
same
order
Thacker, 1926; Greenwald, 1942) and the imponder-
of calcium
binding,
differing
sharply
from human.
Vol. 47
325
ADVERTISEMENT
0 votes
Related Articles
Related forms


Related Categories
Parent category: Miscellaneous