Research Process Flowchart Page 16
ADVERTISEMENT
 1
1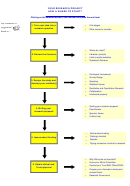 2
2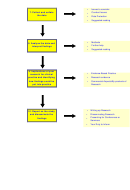 3
3 4
4 5
5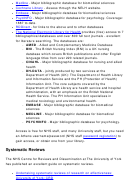 6
6 7
7 8
8 9
9 10
10 11
11 12
12 13
13 14
14 15
15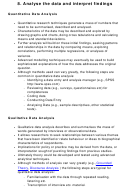 16
16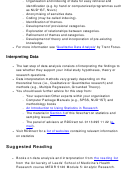 17
17 18
18 19
19 20
20 21
21 22
228. Analyse the data and interpret findings
Quantitative Data Analysis
Quantitative research techniques generate a mass of numbers that
need to be summarised, described and analysed.
Characteristics of the data may be described and explored by
drawing graphs and charts, doing cross tabulations and calculating
means and standard deviations.
Further analysis will build on these initial findings, seeking patterns
and relationships in the data by comparing means, exploring
correlations, performing multiple regressions, or analyses of
variance.
Advanced modelling techniques may eventually be used to build
sophisticated explanations of how the data addresses the original
question.
Although methods used can vary greatly, the following steps are
common in quantitative data analysis:
Identifying a data entry and analysis manager (e.g., SPSS
)
Reviewing data (e.g., surveys, questionnaires etc) for
completeness
Coding data
Conducting Data Entry
Analysing Data (e.g., sample descriptives, other statistical
tests).
Qualitative Data Analysis
Qualitative data analysis describes and summarises the mass of
words generated by interviews or observational data.
It allows researchers to seek relationships between various themes
that have been identified or relate behaviour or ideas to biographical
characteristics of respondents.
Implications for policy or practice may be derived from the data, or
interpretation sought of puzzling findings from previous studies.
Ultimately theory could be developed and tested using advanced
analytical techniques.
Although methods of analysis can vary greatly (e.g.,
Grounded
Theory,
Discourse Analysis
) the following steps are typical for
qualitative data analysis:
Familiarisation with the data through repeated reading,
listening etc.
Transcription of interview etc. material.
ADVERTISEMENT
0 votes
Related Articles
Related forms


")


Related Categories
Parent category: Business