Research Process Flowchart Page 17
ADVERTISEMENT
 1
1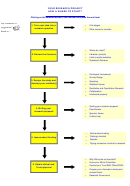 2
2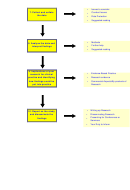 3
3 4
4 5
5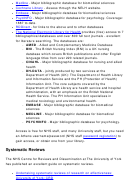 6
6 7
7 8
8 9
9 10
10 11
11 12
12 13
13 14
14 15
15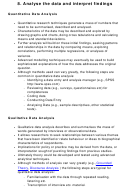 16
16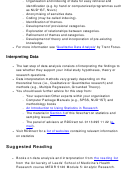 17
17 18
18 19
19 20
20 21
21 22
22Organisation and indexing of data for easy retrieval and
identification (e.g. by hand or computerized programmes such
as NUD*IST, Nvivo)
Anonymising of sensitive data.
Coding (may be called indexing).
Identification of themes.
Development of provisional categories.
Exploration of relationships between categories.
Refinement of themes and categories.
Development of theory and incorporation of pre-existing
knowledge.
For more information see
'Qualitative Data
Analysis' by Trent Focus.
Interpreting Data
The last step of data analysis consists of interpreting the findings to
see whether they support your initial study hypotheses, theory or
research questions.
Data interpretation methods vary greatly depending on the
theoretical focus (i.e., Qualitative or Quantitative research) and
methods (e.g., Multiple Regression, Grounded Theory).
You should seek further advice for this step from:
Your supervisor/Other experts within your organization
Computer Package Manuals (e.g., SPSS, NUD*IST) and
methodology books
An Introduction to Using Statistics in Research
The material in
Section 3
of this flowchart on statistics and
sampling issues
The panel of advisors at RDDirect tel. 0113 295 11 22
(e-
mail).
Visit RDDirect for a
list of websites
containing relevant information
on statistics
Suggested Reading
Books on data analysis and interpretation from
the reading list
from the University of Leeds’ School of Medicine’s Health
Research course MEDR 5120 Module 5: Analytic Research.
ADVERTISEMENT
0 votes
Related Articles
Related forms


")


Related Categories
Parent category: Business