Business Plan Template Page 13
ADVERTISEMENT
 1
1 2
2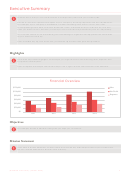 3
3 4
4 5
5 6
6 7
7 8
8 9
9 10
10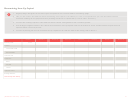 11
11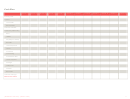 12
12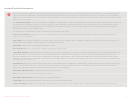 13
13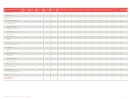 14
14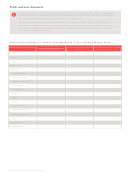 15
15 16
16 17
17 18
18Income Projection Statement
The Income Projection Statement is another management tool to preview the amount of income generated each month based on reasonable predictions
of the monthly level of sales and costs/expenses. As the monthly projections are developed and entered, these figures serve as goals to control operating
expenses. As actual results occur, a comparison with the predicted amounts should produce warning bells if costs are getting out of line so that steps can be
taken to correct problems.
The Industrial Percentage (Ind. %) is calculated by multiplying costs/expenses by 100% and dividing the result by total net sales. It indicates the total sales that
are standard for a particular industry. You may be able to get this information from trade associations, accountants, banks, or reference libraries. Industry
figures are a useful benchmark against which to compare the costs/expenses of your own business. Compare your annual percentage with the figure
indicated in the industry percentage column.
The following is an explanation for some of the terms used in the table that follows:
Total Net Sales (Revenue): This figure is your total estimated sales per month. Be as realistic as possible, taking into consideration seasonal trends, returns,
allowances, and markdowns.
Cost of Sales: To be realistic, this figure must include all the costs involved in making a sale. For example, where inventory is concerned, include the cost of
transportation and shipping. Any direct labor cost should also be included.
Gross Profit: Subtract the cost of sales from the total net sales.
Gross Profit Margin: This is calculated by dividing gross profits by total net sales.
Controllable Expenses: Salaries (base plus overtime), payroll expenses (including paid vacations, sick leave, health insurance, unemployment insurance and
social security taxes), cost of outside services (including subcontracts, overflow work and special or one-time services), supplies (including all items and
services purchased for use in the business), utilities (water, heat, light, trash collection, etc.), repair and maintenance (including both regular and periodic
expenses, such as painting), advertising, travel and auto (including business use of personal car, parking, and business trips), accounting and legal (the cost
of outside professional services).
Fixed Expenses: Rent (only for real estate used in business), depreciation (the amortization of capital assets), insurance (fire, liability on property or products,
workers’ compensation, theft, etc.), loan repayments (include the interest and principal payments on outstanding loans to the business), miscellaneous
(unspecified, small expenditures not included under other accounts or headings).
Net Profit/Loss (Before Taxes): Subtract total expenses from gross profit.
Taxes: Inventory, sales, excise, real estate, federal, state, etc.
Net Profit/Loss (After Taxes): Subtract taxes from net profit before taxes.
Annual Total: Add all monthly figures across the table for each sales and expense item.
Annual Percentage: Multiply the annual total by 100% and divide the result by the total net sales figure. Compare to industry percentage in first column.
[BUSINESS PLAN TITLE] - [SELECT DATE]
12
ADVERTISEMENT
0 votes
Related Articles
Related forms


Related Categories
Parent category: Business