Ap Statistics Math Worksheet
ADVERTISEMENT
 1
1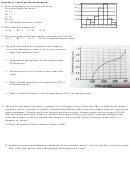 2
2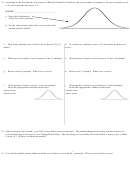 3
3 4
4AP Statistics
(Mostly) Normal Curve Test
Name:
1.
A professor has kept records of grades that students have earned in his class. If he wants to examine the percentage of students
earning the grades A, B, C, D and F during the most recent term, which kind of plot could he make?
A) Boxplot
B) Timeplot
C) Dot Plot
D) Pie Chart
E) Histogram
2.
Which is true of this histogram.
I.
The distribution is approximately symmetric.
II. The mean and median are approximately equal.
III. The median would be a better description of the center than the mean.
A) I only
B) III only
C) I and II
D) I and III
E) I, II, and III
3.
Which is true of this histogram.
I.
The distribution is approximately symmetric.
II. The mean and median are approximately equal.
III. The median would be a better description of the center than the mean.
A) I only
B) III only
C) I and II
D) I and III
E) I, II, and III
4. Two classes took the same quiz. The first class had 15 students who had a mean score of 80. The second class had 20 students
who had a mean score of 90. Altogether, what was the approximate mean score for all the students?
A) 84.3
B) 85
C) 85.7
D) None of these
E) It cannot be found
rd
5. Your Stat teacher tells you your test score was the 3
quartile for the class. Which is true?
I.
You got 75% correct on the test.
II. You can’t really tell what this means without knowing the standard deviation.
III. You did better that 75% of the other students.
A) I only
B) II only
C) III only
D) I and III
E) None of them are true.
6. Your stat teacher tells you your z-score on a test was 2.5. What does this mean?
A) You scored 2.5 points above average.
B) You scored 2.5 standard deviations above average.
C) Your standard deviation is 2.5.
D) Your score is 2.5 times the average of the class.
E) None of these
7. Here is the five number summary for the number of credits 24 college students have completed: 13
15
16.5
18
22
Which statement is true?
A) There are no outliers in this data.
B) There is at least one low outlier in the data.
C) There is at least one high outlier in the data.
D) There are both low and high outliers in the data.
E) It is impossible to tell anything about outliers from the given information.
ADVERTISEMENT
0 votes
Related Articles
Related forms


Related Categories
Parent category: Education