Bmi Chart With Instructions Page 2
ADVERTISEMENT
 1
1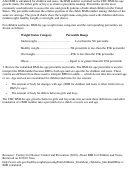 2
2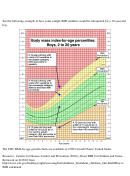 3
3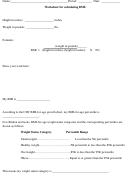 4
4After BMI is calculated for children and teens, the BMI number is plotted on the CDC BMI-for-age
growth charts (for either girls or boys) to obtain a percentile ranking. Percentiles are the most
commonly used indicator to assess the size and growth patterns of individual children in the United
States. The percentile indicates the relative position of the child's BMI number among children of the
same sex and age. The growth charts show the weight status categories used with children and teens
(underweight, healthy weight, overweight, and obese).
For children and teens, BMI-for-age weight status categories and the corresponding percentiles are
shown as follows:
Weight Status Category
Percentile Range
Underweight……………………………
Less than the 5th percentile
Healthy weight………………………….5th percentile to less than the 85th percentile
Overweight……………………………...85th to less than the 95th percentile
Obese…………………………………...Equal to or greater than the 95th percentile
3. Review the calculated BMI-for-age percentile and results. The BMI-for-age percentile is used to
interpret the BMI number because BMI is both age-and sex-specific for children and teens. These
criteria are different from those used to interpret BMI for adults — which do not take into account age
or sex. Age and sex are considered for children and teens for two reasons:
•
The amount of body fat changes with age. (BMI for children and teens is often referred to as
BMI-for-age.)
•
The amount of body fat differs between girls and boys.
The CDC BMI-for-age growth charts for girls and boys take into account these differences and allow
translation of a BMI number into a percentile for a child's or teen's sex and age.
Resource: Centers for Disease Control and Prevention (2010), About BMI for Children and Teens,
Retrieved on 6/23/10 from
is
BMI calculated
ADVERTISEMENT
0 votes
Related Articles
Related forms


 For Use With The Weight Management Treatment Algorithm")
 For Use With The Weight Management Treatment Algorithm")


Related Categories
Parent category: Medical