Adult Body Mass Index Chart
ADVERTISEMENT
 1
1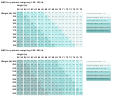 2
2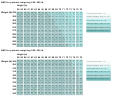 3
3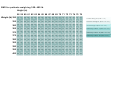 4
4Adult Weight Management Guideline (≥18 Years)
BMI Chart
Body Mass Index Chart
Note: The BMI does not take into account the difference between lean and fat body mass. Therefore, it is possible for a healthy, muscular individual
with very low body fat to be classified as overweight or obese using the BMI formula.
BMI for patients weighing 100–145 lb
Height (in)
58 59 60 61 62 63 64 65 66 67 68 69 70 71 72 73 74 75 76
Weight (lb) 100
21 20 20 19 18 18 17 17 16 16 15 15 14 14 14 13 13 13 12
Underweight (BMI <19)
105
22 21 21 20 19 19 18 18 17 16 16 16 15 15 14 14 14 13 13
Normal Weight (BMI 19–24)
110
23 22 22 21 20 20 19 18 18 17 17 16 16 15 15 15 14 14 14
Overweight (BMI 25–29)
115
24 23 23 22 21 20 20 19 19 18 18 17 17 16 16 15 15 14 14
Obesity Class I (BMI 30–34)
120
25 24 23 23 22 21 21 20 19 19 18 18 17 17 16 16 15 15 15
Obesity Class II (BMI 35–39)
125
26 25 24 24 23 22 22 21 20 20 19 18 18 17 17 17 16 16 15
Obesity Class III (BMI ≥40)
130
27 26 25 25 24 23 22 22 21 20 20 19 19 18 18 17 17 16 16
135
28 27 26 26 25 24 23 23 22 21 21 20 19 19 18 18 17 17 16
140
29 28 27 27 26 25 24 23 23 22 21 21 20 20 19 19 18 18 17
145
30 29 28 27 27 26 25 24 23 23 22 21 21 20 20 19 19 18 18
ADVERTISEMENT
0 votes
Related Articles
Related forms


")

 Template - Color")


Related Categories
Parent category: Medical