Practice Assignment History Worksheets Page 3
ADVERTISEMENT
 1
1 2
2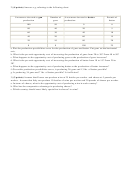 3
32) (4 points) Answer a-g, referring to the following chart
%resources devoted to gun
Number of
%resources devoted to butter
Pounds of
production
guns
production
butter
100
50
0
0
80
40
20
5
60
30
40
10
40
20
60
15
20
10
80
20
0
0
100
25
a. Plot the production possibilities curve for the production of guns and butter. Put guns on the horizontal
axis.
b. What is the per unit opportunity cost of increasing the production of guns from 20 to 30? From 40 to 50?
c. What happens to the opportunity cost of producing guns as the production of guns increases?
d. What is the per unit opportunity cost of increasing the production of butter from 10 to 15? From 20 to
30?
e. What happens to the opportunity cost of producing butter as the production of butter increases?
f. Given this production possibilities curve, is producing 26 guns and 13 lbs. of butter possible?
g. Is producing 34 guns and 7 lbs. of butter possible? Is it efficient?
3) (3 points) Assume that France can produce wine at 25 bottles per worker and cheese at 5 pounds per
worker. Assume that Italy can produce 10 bottles of wine per worker and 20 pounds of cheese per worker.
a. In terms of cheese, what is the opportunity cost of producing wine in each country?
b. Who has the comparative advantage in producing cheese?
c. Which country should most likely specialize in cheese? in wine?
ADVERTISEMENT
0 votes
Related Articles
Related forms


Related Categories
Parent category: Education