Unit 2 Assessment Study Guide - Riverdale Middle School Page 2
ADVERTISEMENT
 1
1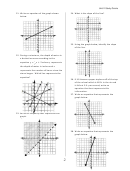 2
2Unit 2 Study Guide
21. Write an equation of the graph shown
24. What is the slope of the line?
below.
25. Using the graph below, identify the slope
of the line.
22. During a rainstorm, the depth of water in
a bucket increase according to the
equation
where y represents
the depth of water in inches and x
represents the number of hours since the
storm began. Which line represents the
equation?
26. If Jill throws a paper airplane off of the top
of the school which is 60 ft. in the air and
it falls at 2 ft. per second, write an
equation that best represents this
information.
27. Write an equation that represents the
graph below.
23. Write an inequality that represents the
graph.
28. Write an equation that represents the
graph below.
2
ADVERTISEMENT
0 votes
Related Articles
Related forms


 - Middle School Reading Article Worksheet")


Related Categories
Parent category: Education