Tables Of The Normal Cumulative Distribution Page 2
ADVERTISEMENT
 1
1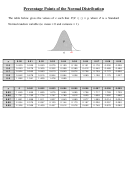 2
2Percentage Points of the Normal Distribution
The table below gives the values of z such that P(Z „ z) = p, where Z is a Standard
Normal random variable (ie. mean = 0 and variance = 1).
0.00
0.01
0.02
0.03
0.04
0.05
0.06
0.07
0.08
0.09
p
0.5
0.000
0.025
0.050
0.075
0.100
0.126
0.151
0.176
0.202
0.228
0.6
0.253
0.279
0.305
0.332
0.358
0.385
0.412
0.440
0.468
0.496
0.7
0.524
0.553
0.583
0.613
0.643
0.674
0.706
0.739
0.772
0.806
0.8
0.842
0.878
0.915
0.954
0.994
1.036
1.080
1.126
1.175
1.227
0.9
1.282
1.341
1.405
1.476
1.555
p
0
0.001
0.002
0.003
0.004
0.005
0.006
0.007
0.008
0.009
0.95
1.645
1.655
1.665
1.675
1.685
1.695
1.706
1.717
1.728
1.739
0.96
1.751
1.762
1.774
1.787
1.799
1.812
1.825
1.838
1.852
1.866
0.97
1.881
1.896
1.911
1.927
1.943
1.960
1.977
1.995
2.014
2.034
0.98
2.054
2.075
2.097
2.120
2.144
2.170
2.197
2.226
2.257
2.290
0.99
2.326
2.366
2.409
2.457
2.512
2.576
2.652
2.748
2.878
3.090
ADVERTISEMENT
0 votes
Related Articles
Related forms


")


")


")
Related Categories
Parent category: Education