Owl Pellet Lab Student Data Sheet Page 2
ADVERTISEMENT
 1
1 2
2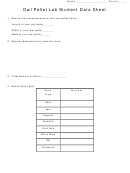 3
3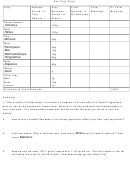 4
45. Count the number of each type of bone and record the information on your bones data
table.
6. Reassemble the skeletons by laying them out on a piece of paper. Glue or tape the
skeletons on the paper. Label the bones you have identified. You will only get credit if it looks
like an animal skeleton. If it looks like a bunch of bones taped on a piece of paper, you won’t
get the credit.
Using a Dichotomous Key to identify Prey
7. Use the supplemental handout with the dichotomous key to identify the skulls in your pellet
number found in your sample
and fill out the
column on your owl prey chart.
Barn Owl Diet
8. As you have seen from the dichotomous key, there are many genera of prey that occur in
the northwestern region of the United States. Any other animal remains you find in your pellet
from a bird, bat or insect. List them as “other prey” on the owl prey chart.
total number
9. Your teacher will gather class totals for each type of prey. Record these in the
of samples
column on your chart. To calculate the total biomass, multiply the numbers in the
total number
prey biomass.
column by the numbers listed for
cumulative biomass total
10. Add all of the totals together to get a
for all of the owls your class
sampled. Record this value on your chart.
11. Now it is possible to get a good idea of what each prey species contributes to the diet of
the northwestern barn-owl population that contributed to the owl pellets. To calculate the
total
percent each species contributed to the cumulative total biomass, you can divide the each
biomass
cumulative total biomass
value by the
. Write your results in the % Biomass column.
Your total should add up to 100%.
ADVERTISEMENT
0 votes
Related Articles
Related forms


Related Categories
Parent category: Education