Uk Body Mass Index Bmi Charts
ADVERTISEMENT
 1
1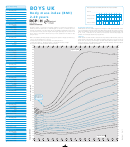 2
2GIRLS UK
Data Recording
Please place sticker (if available) otherwise write in space provided.
Measurement 1
Recording Date
Body mass index BMI)
Name:
________________________________________
Weight
Length/Height
2-20 years
NHS /CHI No:
BMI
Location
Hospital No:
Health worker name
Measurement 2
Date of Birth:
Recording Date
Weight
Overweight and obesity
The BMI centile is a simple and reliable indicator of thinness and fatness in
Length/Height
A BMI above the 91st centile suggests overweight. A child above the 98th centile
childhood. Where severe over- or underweight is a concern, or where there is a
BMI
is very overweight (clinically obese) while a BMI above the 99.6th centile is severely
need for monitoring over time, BMI can be calculated and plotted on this chart.
obese. In addition to the usual nine centile lines, the BMI chart displays high lines
Location
It is important also to plot the height and weight separately on the main 2-18
at +3, +3.33, +3.66 and + 4 SD, which can be used to monitor the progress of
chart. There is also a BMI centile look-up on the standard 2-18 chart for less
Health worker name
children in overweight treatment programmes.
complex cases.
Measurement 3
Thinness
BMI is calculated by dividing weight (in kg) by the square of height (in metres e.g.
Recording Date
A BMI below the 2nd centile is unusual and may reflect undernutrition, but may
1.32 m, not centimetres e.g. 132 cm).
simply reflect a small build. The chart also displays low lines at -4 and -5 SD for
Weight
A simple way to do this on a calculator or mobile phone is:
those who are severely underweight. Children whose BMI lies below the 0.4th
Length/Height
1. Enter the weight. 2. Divide by height. 3. Divide the result by height.
centile are likely to have additional problems and if not already receiving medical
BMI
The result can then be plotted on the chart below.
or dietetic attention should be referred.
Location
50
50
2
3
4
5
6
7
8
9
10
11
12
13
14
15
16
17
18
19
20
Health worker name
49
49
Measurement 4
Age in years
48
48
Recording Date
47
47
Weight
46
46
Length/Height
BMI
45
45
Location
44
44
Health worker name
43
43
Measurement 5
42
42
Recording Date
41
41
Weight
40
40
Length/Height
BMI
39
39
Location
38
38
Health worker name
37
37
Measurement 6
36
36
Recording Date
35
35
Weight
34
34
Length/Height
BMI
33
33
Location
32
32
Health worker name
31
31
Measurement 7
30
30
Recording Date
Transit point
29
29
Weight
from UK-WHO
Length/Height
28
to UK90 data.
28
BMI
27
27
Location
26
26
Health worker name
25
25
Measurement 8
24
24
Recording Date
23
23
Weight
Length/Height
22
22
BMI
21
21
Location
20
20
Health worker name
19
19
Measurement 9
18
18
Recording Date
Weight
17
17
Length/Height
16
16
BMI
15
15
Location
14
14
Health worker name
13
13
Measurement 10
12
12
Recording Date
Weight
11
11
Length/Height
Age in years
10
10
BMI
9
9
2
3
4
5
6
7
8
9
10
11
12
13
14
15
16
17
18
19
20
Location
8
8
Health worker name
ADVERTISEMENT
0 votes
Related Articles
Related forms
 Chart")
 Chart")
 - Hackleyhealthmanagement")
 Charts - Boys And Girls")
 Chart")
 Wall Chart")
 Worksheet")


 Table - Colored")
Related Categories
Parent category: Medical