Cumulative Poisson Distribution Table
ADVERTISEMENT
 1
1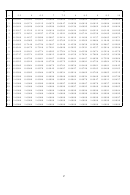 2
2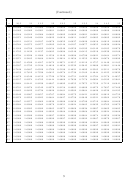 3
3Cumulative Poisson Distribution Table
Table shows cumulative probability functions of Poisson Distribution with various . Exam-
ple: to find the probability P(X
3) where X has a Poisson Distribution with
= 2, look
in row 4 and column 4 to find P(X
3)=0.8571 where X is Poisson(2).
x
0.5
1
1.5
2
2.5
3
3.5
4
4.5
5
0
0.6065
0.3679
0.2231
0.1353
0.0821
0.0498
0.0302
0.0183
0.0111
0.0067
1
0.9098
0.7358
0.5578
0.4060
0.2873
0.1991
0.1359
0.0916
0.0611
0.0404
2
0.9856
0.9197
0.8088
0.6767
0.5438
0.4232
0.3208
0.2381
0.1736
0.1247
3
0.9982
0.9810
0.9344
0.8571
0.7576
0.6472
0.5366
0.4335
0.3423
0.2650
4
0.9998
0.9963
0.9814
0.9473
0.8912
0.8153
0.7254
0.6288
0.5321
0.4405
5
1.0000
0.9994
0.9955
0.9834
0.9580
0.9161
0.8576
0.7851
0.7029
0.6160
6
1.0000
0.9999
0.9991
0.9955
0.9858
0.9665
0.9347
0.8893
0.8311
0.7622
7
1.0000
1.0000
0.9998
0.9989
0.9958
0.9881
0.9733
0.9489
0.9134
0.8666
8
1.0000
1.0000
1.0000
0.9998
0.9989
0.9962
0.9901
0.9786
0.9597
0.9319
9
1.0000
1.0000
1.0000
1.0000
0.9997
0.9989
0.9967
0.9919
0.9829
0.9682
10
1.0000
1.0000
1.0000
1.0000
0.9999
0.9997
0.9990
0.9972
0.9933
0.9863
11
1.0000
1.0000
1.0000
1.0000
1.0000
0.9999
0.9997
0.9991
0.9976
0.9945
12
1.0000
1.0000
1.0000
1.0000
1.0000
1.0000
0.9999
0.9997
0.9992
0.9980
13
1.0000
1.0000
1.0000
1.0000
1.0000
1.0000
1.0000
0.9999
0.9997
0.9993
14
1.0000
1.0000
1.0000
1.0000
1.0000
1.0000
1.0000
1.0000
0.9999
0.9998
15
1.0000
1.0000
1.0000
1.0000
1.0000
1.0000
1.0000
1.0000
1.0000
0.9999
16
1.0000
1.0000
1.0000
1.0000
1.0000
1.0000
1.0000
1.0000
1.0000
1.0000
1
ADVERTISEMENT
0 votes
Related Articles
Related forms


 Distribution Chart")


Related Categories
Parent category: Education