Owl Pellet Dissection, A Study Of Food Chains Worksheet Page 2
ADVERTISEMENT
 1
1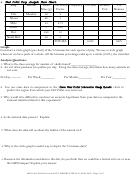 2
24. Owl Pellet Prey Analysis Data Chart:
Prey
Habitat
Mean
Conversion
Frequency
% of Diet
Biomass
% of
Mass (g)
Factor
Unit
Biomass
Vole
Meadow
40
2
Mouse
20
1
Mole
55
2.75
Shrew
5
0.25
Rat
240
12
Small Bird
40
2
TOTALS
100%
100%
Graph:
Construct a circle graph (pie chart) of the % biomass for each species of prey. We use a circle graph
whenever we have parts of a whole. All the biomass percentages add up to a whole (100%), the total diet.
Analysis Questions:
1. What is the class average for number of skulls found?_________________
2. An owl often produces two pellets per day. Using the class average, determine how many animals an
owl eats:
Per day: ---------
Per Week:_________
Per Month:_________
Per Year:_________
2. Use our class data in comparison to the “Barn Owl Pellet Interactive Study Results” chart to
predict the region from which your Owl Pellet was retrieved:
3. Why would it be difficult to construct an accurate hypothesis from your data as compared to the
national statistical data for this experiment?
4. Is the national data precise? Explain.
3. What does the data tell us about the habitat of the barred owl?
4. Why is the circle graph a useful way to depict the % biomass data?
5. Based on the information and data in this lab, do you think that we could have barred owls on or near
the GHS Campus? Explain your answer.
APES: Owl Pellet Dissection DATA, OBSERVATIONS & ANALYSIS. Page 2 of 2
ADVERTISEMENT
0 votes
Related Articles
Related forms


Related Categories
Parent category: Education