Star Color & Temperature Worksheet
ADVERTISEMENT
 1
1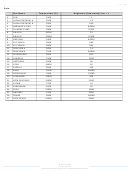 2
2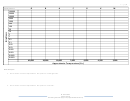 3
3 4
4P a g e
| 1
Name______________________
Star Color & Temperature
Purpose: To examine the relationship between star color and temperature
Background Information:
Stars are classified by their spectra (the elements that they absorb) – this is the color of a star. They are also
classified by their temperature. There are seven main types of stars. In order of decreasing temperature, the
classifications are O, B, A, F, G, K, and M.
The Hertzsprung -Russell (H-R) Diagram is a graph that plots stars color (spectral type or surface temperature)
vs. its luminosity (intrinsic brightness or absolute magnitude). On it, astronomers plot stars' color,
temperature, luminosity, spectral type, and evolutionary stage. This diagram shows that there are 3 very
different types of stars:
Most stars, including the sun, are "main sequence stars," fueled by nuclear
fusion converting hydrogen into helium. For these stars, the hotter they are, the brighter. These stars
are in the most stable part of their existence; this stage generally lasts for about 5 billion years.
As stars begin to die, they become giants and supergiants (above the main sequence). These stars have
depleted their hydrogen supply and are very old. The core contracts as the outer layers expand. These
stars will eventually explode (becoming a planetary nebula or supernova, depending on their mass)
and then become white dwarfs, neutron stars, or black holes (again depending on their mass).
Smaller stars (like our Sun) eventually become faint white dwarfs (hot, white, dim stars) that are below
the main sequence. These hot, shrinking stars have depleted their nuclear fuels and will eventually
become cold, dark, black dwarfs. ( )
Materials:
Colored pencils (red, orange, yellow, blue)
Procedure:
1. Study the star data charts given.
2. Note that the sun is used as a standard of brightness, and is given a value of 1. The brightness given for
each other star shows how that star compares with the sun.
3. Plot the data from both charts on the graph.
o
o
4. Stars with surface temperatures up to 3,500
C are red. Lightly color a vertical band from 2000
C to
o
3500
C a light red.
o
o
5. Lightly color other bands as follows: Stars up to 5000
C are orange-red, up to 6000
C yellow-white, up
o
o
to 7500
C blue-white, and up to 40,000
C blue.
6. Label the main sequence, red super giants, and the white dwarf stars.
7. Circle and label dwarf stars, red giants, blue giants and main sequence stars.
M. Poarch 2015
science-class.net
Permission granted to copy for non-profit, educational use only.
ADVERTISEMENT
0 votes
Related Articles
Related forms


")

Related Categories
Parent category: Education