Evaluating And Graphing Polynomial Functions Page 4
ADVERTISEMENT
 1
1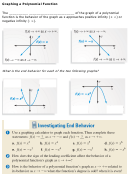 2
2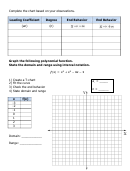 3
3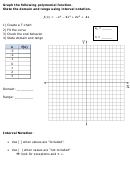 4
4Graph the following polynomial function.
State the domain and range using interval notation.
( )
1) Create a T-chart
a
= _____
2) Fit the curve
n
3) Check the end behavior
n = ______
4) State domain and range
x
f(x)
-3
-2
-1
0
1
2
3
Domain: _________
Range: __________
Interval Notation:
Use [ ] when values are “included”.
Use ( ) when values are “not included”
look for exceptions and ± .
ADVERTISEMENT
0 votes
Related Articles
Related forms

 Behavior Worksheet")


Related Categories
Parent category: Education