Matching Pictographs To Charts Worksheet Page 19
ADVERTISEMENT
 1
1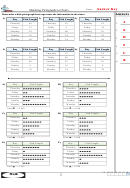 2
2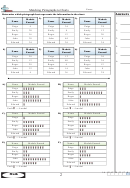 3
3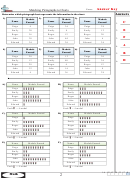 4
4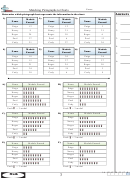 5
5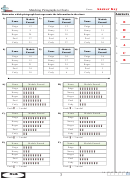 6
6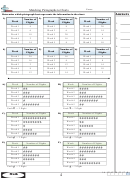 7
7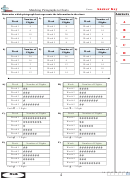 8
8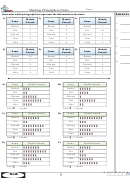 9
9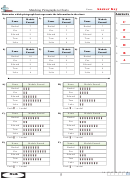 10
10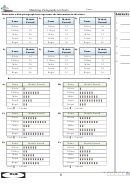 11
11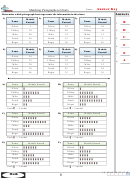 12
12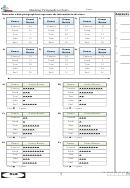 13
13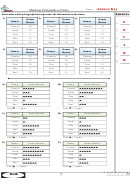 14
14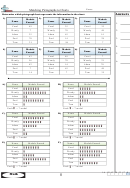 15
15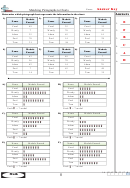 16
16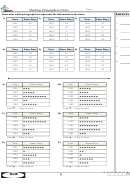 17
17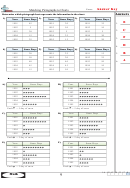 18
18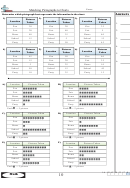 19
19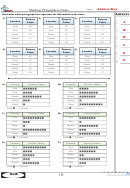 20
20Name:
Matching Pictographs to Charts
Determine which pictograph best represents the information in the chart.
A n s w e r s
1)
2)
3)
Pictures
Pictures
Pictures
Location
Location
Location
A
Taken
Taken
Taken
1.
Zoo
30
Zoo
20
Zoo
35
B
Fair
20
Fair
40
Fair
5
2.
Home
40
Home
35
Home
40
D
School
15
School
5
School
15
3.
Party
5
Party
50
Party
45
C
4.
4)
5)
6)
Pictures
Pictures
Pictures
Location
Location
Location
E
Taken
Taken
Taken
5.
Zoo
45
Zoo
50
Zoo
40
F
Fair
15
Fair
20
Fair
35
6.
Home
5
Home
25
Home
10
School
50
School
15
School
45
Party
10
Party
35
Party
15
A)
B)
Location
Pictures Taken
Location
Pictures Taken
Zoo
Zoo
Fair
Fair
Home
Home
School
School
Party
Party
Each
= 5 picture
Each
= 5 picture
C)
D)
Location
Pictures Taken
Location
Pictures Taken
Zoo
Zoo
Fair
Fair
Home
Home
School
School
Party
Party
Each
= 5 picture
Each
= 5 picture
E)
F)
Location
Pictures Taken
Location
Pictures Taken
Zoo
Zoo
Fair
Fair
Home
Home
School
School
Party
Party
Each
= 5 picture
Each
= 5 picture
1-6
83 67 50 33 17 0
10
Math
ADVERTISEMENT
0 votes
Related Articles
Related forms


Related Categories
Parent category: Education