Matching Graphs Worksheet With Answer Key Page 17
ADVERTISEMENT
 1
1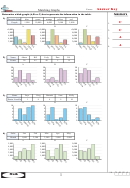 2
2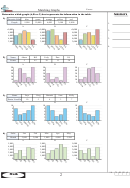 3
3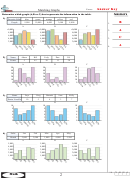 4
4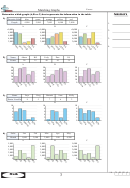 5
5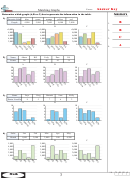 6
6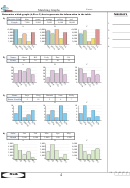 7
7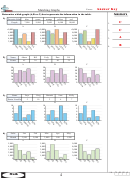 8
8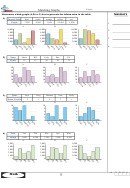 9
9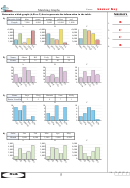 10
10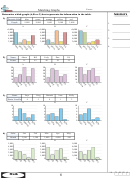 11
11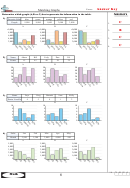 12
12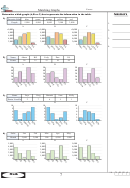 13
13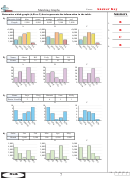 14
14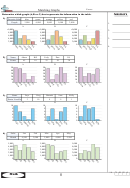 15
15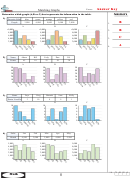 16
16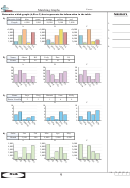 17
17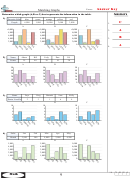 18
18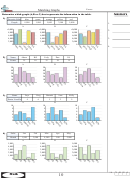 19
19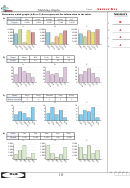 20
20Name:
Matching Graphs
Determine which graph (A,B or C) best represents the information in the table.
A n s w e r s
1)
Favorite Color
blue
green
orange
yellow
red
C
People
6,000
1,000
10,000
2,000
3,000
1.
A
B
C
A
10,000
10,000
10,000
2.
8,000
8,000
8,000
6,000
6,000
6,000
B
3.
4,000
4,000
4,000
2,000
2,000
2,000
0
0
0
A
4.
2)
Name
Adam
Bill
Cody
Dan
Ed
Points
25
40
30
10
20
A
B
C
50
50
50
40
40
40
30
30
30
20
20
20
10
10
10
0
0
0
3)
Name
Faye
Greg
Hannah
Jane
Kelly
States Lived In
2
3
1
6
4
A
B
C
10
10
10
8
8
8
6
6
6
4
4
4
2
2
2
0
0
0
4)
Sales
Jan
Feb
Mar
Apr
May
Month
2,500
500
4,000
2,000
4,500
A
B
C
5,000
5,000
5,000
4,000
4,000
4,000
3,000
3,000
3,000
2,000
2,000
2,000
1,000
1,000
1,000
0
0
0
1-4
75 50 25 0
9
Math
ADVERTISEMENT
0 votes
Related Articles
Related forms


Related Categories
Parent category: Education