Reading A Bar Graph Worksheet With Answer Key
ADVERTISEMENT
 1
1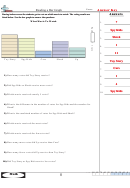 2
2Name:
Reading a Bar Graph
During indoor recess the students got to vote on which movie to watch. The voting results are
A n s w e r s
listed below. Use the bar graph to answer the questions.
What Movie To Watch
7
1.
Spy Kids
2.
Shrek
3.
1
4.
11
5.
Toy Story
Spy Kids
Cars
Shrek
Up
Toy Story
6.
Cars
7.
1) How many votes did Toy Story receive?
1
8.
4
9.
2) Did Spy Kids or Shrek receive more votes?
Spy Kids
10.
3) Which movie received exactly 5 votes?
4) What is the difference in the number of votes for Spy Kids and the number for
Shrek?
5) What is the combined number of votes for Spy Kids and Shrek?
6) Which movie received the most votes?
7) Which movie received the fewest votes?
8) How many more votes did Up receive than Cars?
9) How many fewer votes did Up receive than Toy Story?
10) Did Toy Story or Spy Kids receive less votes?
90 80 70 60 50 40 30 20 10 0
1-10
8
Math
ADVERTISEMENT
0 votes
Related Articles
Related forms


Related Categories
Parent category: Education