Evaluate And Graph Polynomial Functions Page 3
ADVERTISEMENT
 1
1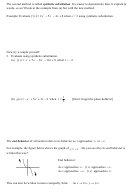 2
2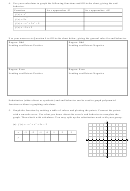 3
3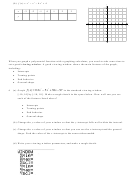 4
44. Use your calculator to graph the following functions and fill in the chart, giving the end
behavior.
∞
−∞
Function
As x approaches
As x approaches
f (x) = x
6
f (x) = 2x
5
f (x) = −x
+ 3x
− 5
4
2
f (x) = −3x + 2
Use your answers to Question 4 to fill in the chart below, giving the general rules for end behavior.
Degree: Odd
Degree: Odd
Leading coefficient: Positive
Leading coefficient: Negative
Degree: Even
Degree: Even
Leading coefficient: Positive
Leading coefficient: Negative
Substitution (either direct or synthetic) and end behavior can be used to graph polynomial
1
2
3
4
5
– 1
– 2
– 3
– 4
– 5
1
2
3
4
5
– 1
– 2
– 3
– 4
– 5
functions without a graphing calculator.
5. Graph the function by making a table of values and plotting the points. Connect the points
with a smooth curve. Use what you know about the curve's end behavior to complete the
graph. Then check with calculator. You may split up the substitution work with your group.
y
5
f (x) = −x
+ x
+ 3x − 3
(a)
3
2
4
3
x
-3
-2
-1
0
1
2
3
2
1
y
x
– 5
– 4
– 3
– 2
– 1
1
2
3
4
5
– 1
– 2
– 3
– 4
– 5
ADVERTISEMENT
0 votes
Related Articles
Related forms

 Behavior Worksheet")


Related Categories
Parent category: Education