Junior Certificate Examination 2011 Sample Paper Mathematics Page 8
ADVERTISEMENT
 1
1 2
2 3
3 4
4 5
5 6
6 7
7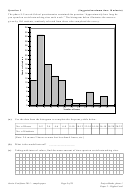 8
8 9
9 10
10 11
11 12
12 13
13 14
14 15
15 16
16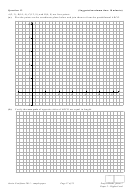 17
17 18
18 19
19 20
20 21
21 22
22 23
23 24
24Question 5
(Suggested maximum time: 10 minutes)
The phase 9 CensusAtSchool questionnaire contained the question “Approximately how long do
you spend on social networking sites each week.” The histogram below illustrates the answers
given by 100 students, randomly selected from those who completed the survey.
34
32
30
28
26
24
22
20
18
16
14
12
10
8
6
4
2
0
2
4
6
8
10
14
16
18
20
22
12
Number of hours
(a)
Use the data from the histogram to complete the frequency table below.
No. of Hours
0-2
2-4
4-6
6-8
8-10 10-12 12-14 14-16 16-18 18-20 20-22
No. of Students
[Note: 2-4 means 2 hours or more but less than 4 hours, etc.]
(b)
What is the modal interval? __________________
(c)
Taking mid-interval values, find the mean amount of time spent on social networking sites.
Junior Certificate 2011 – sample paper
Page 8 of 23
Project Maths, phase 1
Paper 2 – Higher Level
ADVERTISEMENT
0 votes
Related Articles
Related forms


Related Categories
Parent category: Education