Form Adv: U3-1 - Annual Report To State Of Alabama Department Of Revenue - 2011 Page 4
ADVERTISEMENT
 1
1 2
2 3
3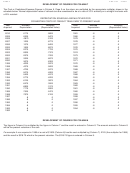 4
4PAGE 4
ADV: U3-1
TY 2011
DEVELOPMENT OF FIGURES FOR COLUMN 7
The Cost or Capitalized Expense Figures in Column 6, Page 3 on the return are multiplied by the appropriate multiplier shown in the
schedule below. Normal depreciation rates of railroad cars are considered to be at a rate of 3.5% annually on a straight line basis with
a 20% residual.
DEPRECIATION SCHEDULE AND MULTIPLIER FOR
CONVERTING COSTS OF FREIGHT TRAIN CARS TO PRESENT VALUE
Year
Accrued
Multiplier
Year
Accrued
Multiplier
Acquired
Depreciation
(Depreciated Value)
Acquired
Depreciation
(Depreciated Value)
2010
.0175
.9825
1981
.8
.2
2009
1980
.0525
.9475
.8
.2
2008
1979
. 0875
.9125
.8
.2
2007
1978
.1225
.8775
.8
.2
2006
.1575
.8425
1977
.8
.2
2005
1976
.1925
.8075
.8
.2
2004
1975
.2275
.7725
.8
.2
2003
1974
.2625
.7375
.8
.2
2002
.2975
.7025
1973
.8
.2
2001
1972
.3325
.6675
.8
.2
2000
1971
.3675
.6325
.8
.2
1999
1970
.4025
.5975
.8
.2
1998
.4375
.5625
1969
.8
.2
1997
.4725
.5275
1968
.8
.2
1996
1967
.5075
.4925
.8
.2
1995
1966
.5425
.4575
.8
.2
1994
1965
.5775
.4225
.8
.2
1993
.6125
.3875
1964
.8
.2
1992
1963
.6475
.3525
.8
.2
1991
1962
.6825
.3175
.8
.2
1990
1961
.7175
.2825
.8
.2
1989
.7525
.2475
1960
.8
.2
1988
1959
.7875
.2125
.8
.2
1987
1958
.8
.2
.8
.2
1986
1957
.8
.2
.8
.2
1985
.8
.2
1956
.8
.2
1984
1955
.8
.2
.8
.2
1983
1954
.8
.2
.8
.2
1982
.8
.2
DEVELOPMENT OF FIGURES FOR COLUMN 8
The figure in Column 6 is multiplied by the figure in Column 7 and the result is entered in Column 8. The amount entered in Column 8
will be the present valuation of the cars.
For example: A car acquired in 1988 at a cost of $1500 (Column 6) has the cost multiplied by (Column 7) .2125 (the multiplier for 1988)
and the result is $318.75 which is the present valuation. The $318.75 figure is entered in Column 8.
ADVERTISEMENT
0 votes
Related Articles
Related forms


Related Categories
Parent category: Financial