Future Relative Humidity Page 2
ADVERTISEMENT
 1
1 2
2 3
3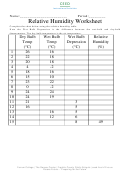 4
4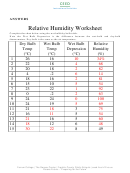 5
5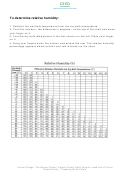 6
6CEED
Instructional Activities
30 Relative humidity charts
Practice worksheets (attached)
Materials Needed
12 sling psychrometers
Per Class of 30
Graph paper
and
Prior Knowledge
•
EXTENSION Graph data and explain trends. Use CEED data (RH and temps) to graph
relationships. Be able to explain relationships between dry bulb and wet bulb temperatures
Ways to
and relative humidity.
differentiate this
lesson plan
•
MODIFICATIONS
Anticipatory Set: From the CEED data, observe
Introduction: Relative humidity (RH) is the
data over the day: Watch for trends of changing
amount of moisture in the air compared with the
temperatures, and the effect on relative
amount of moisture the air can hold at that
humidity. Discuss how air feels in the summer
temperature, given as a percentage. So, warm air
versus the winter in relation to RH.
holds more moisture than cooler air; winter air is
drier and summer air is more humid/sticky.
Questions to ask students:
Describe how or review that when water
•
evaporates, heat is absorbed, causing the surface
What trends are observed from CEED
Introduction/
to feel cooler. This is why we sweat, to help cool
data?
Anticipatory Set
our bodies. Apply this to the wet bulb of a sling
•
Why do you think this happens?
psychrometer. It will cool as it evaporates,
•
What causes warmer air to have a
recording a cooler temperature. If no evaporation
different RH than cooler air?
occurs, it will record the same temperature as the
dry bulb (actual air temp.)
The larger difference between the wet bulb and
dry bulb temperatures, the lower the relative
humidity.
Ferrum College | The Gereau Center | Franklin County Public Schools | ceed.frco.k12.va.us
Parans Futura – “Preparing for the Future”
ADVERTISEMENT
0 votes
Related Articles
Related forms

")


Related Categories
Parent category: Miscellaneous