Number Of N-400 Applications For Naturalization By Category Of Naturalization, Case Status, And Uscis Field Office Location Page 2
ADVERTISEMENT
 1
1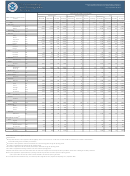 2
2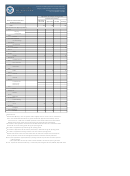 3
3Number of N-400 Applications for Naturalization by Category of
Naturalization, Case Status, and USCIS Field Office Location
July 1 - September 30, 2016
Applications by Category and Case Status
1
1
Naturalization
Naturalization (Military)
Total
Applications
Applications
Applications
USCIS Field Office or Service Center
2
3
4
5
2
3
4
5
2
3
4
5
Location
Received
Approved
Denied
Pending
Received
Approved
Denied
Pending
Received
Approved
Denied
Pending
Total
244,134
226,745
25,943
518,707
1,183
2,336
235
3,858
245,317
229,081
26,178
522,565
New Jersey
Mount Laurel
MTL
2,264
1,496
247
4,599
D
-
-
17
2,265
1,496
247
4,616
Newark
NEW
10,560
10,509
810
22,415
D
D
D
27
10,566
10,518
811
22,442
New Mexico
Albuquerque
ABQ
546
532
31
1,134
D
D
-
14
550
533
31
1,148
New York
Albany
ALB
687
621
105
1,513
-
D
D
D
687
624
106
1,518
Buffalo
BUF
1,232
1,095
181
2,734
D
D
-
15
1,233
1,101
181
2,749
Long Island
LNY
6,211
4,491
665
14,649
D
11
D
13
6,214
4,502
669
14,662
New York
NYC
17,190
20,637
3,174
42,956
10
10
-
49
17,200
20,647
3,174
43,005
Queens
QNS
5,997
4,952
801
12,919
D
D
D
12
5,998
4,956
803
12,931
North Carolina
Charlotte
CLT
2,133
1,740
141
3,922
-
D
-
D
2,133
1,741
141
3,926
Raleigh
RAL
1,755
1,464
78
3,152
24
32
D
82
1,779
1,496
79
3,234
Ohio
Cincinnati
CIN
754
660
46
1,437
D
D
-
D
755
668
46
1,442
Cleveland
CLE
1,055
744
106
1,971
D
D
D
D
1,057
747
107
1,978
Columbus
CLM
1,210
1,165
100
2,377
-
D
-
D
1,210
1,167
100
2,383
Oklahoma
Oklahoma City
OKC
981
1,078
99
2,025
136
298
D
391
1,117
1,376
102
2,416
Oregon
Portland
POO
2,047
1,562
133
3,908
-
D
-
D
2,047
1,567
133
3,913
Pennsylvania
Philadelphia
PHI
5,215
4,820
636
11,675
D
D
-
36
5,222
4,821
636
11,711
Pittsburgh
PIT
769
767
57
1,588
D
D
-
D
771
770
57
1,594
Rhode Island
Providence
PRO
987
850
117
1,741
D
-
-
D
988
850
117
1,742
South Carolina
Charleston
CHL
941
1,250
135
1,771
367
381
95
586
1,308
1,631
230
2,357
Tennessee
Memphis
MEM
1,960
1,809
129
4,144
D
D
-
32
1,968
1,817
129
4,176
Texas
Dallas
DAL
7,329
7,682
732
15,724
D
25
D
32
7,331
7,707
733
15,756
El Paso
ELP
1,766
1,787
130
4,331
D
23
D
37
1,775
1,810
132
4,368
Harlingen
HLG
1,369
802
140
2,999
-
D
-
D
1,369
805
140
3,004
Houston
HOU
7,943
7,953
789
18,258
D
14
D
20
7,947
7,967
792
18,278
San Antonio
SNA
3,753
3,382
210
7,733
69
207
D
590
3,822
3,589
217
8,323
Utah
Salt Lake City
SLC
1,259
768
75
2,633
D
D
D
16
1,262
771
77
2,649
Vermont
St. Albans
STA
194
155
D
357
-
-
-
-
194
155
D
357
Virginia
Norfolk
NOR
1,254
1,423
149
2,984
17
328
12
315
1,271
1,751
161
3,299
Washington
Seattle
SEA
4,142
2,901
350
8,230
12
29
D
76
4,154
2,930
352
8,306
Spokane
SPO
228
213
26
489
D
-
-
D
229
213
26
493
Yakima
YAK
541
359
36
983
-
D
-
D
541
360
36
985
Wisconsin
Milwaukee
MIL
1,103
926
129
2,210
D
D
-
D
1,104
930
129
2,214
6
Field Office by Territory
Guam
Hagatna
AGA
226
125
14
440
D
D
D
D
227
129
15
445
U.S. Virgin Islands
Charlotte Amalie
CHA
110
134
15
179
-
D
-
D
110
135
15
182
Christiansted
CHR
60
80
D
209
-
-
-
D
60
80
D
210
Puerto Rico
San Juan
SAJ
1,039
601
81
2,135
-
-
-
D
1,039
601
81
2,136
D Data withheld to protect applicants' privacy.
- Represents zero.
1
"Military Naturalization" refer to applicants whose eligibility relies on service in the U.S. armed forces. All other N-400 naturalizations are included in "Naturalization."
Total includes both general and military naturalization.
2
The number of new applications received and entered into a case-tracking system during the reporting period.
3
The number of applications approved during the reporting period.
4
The number of applications that were denied, terminated, or withdrawn during the reporting period.
5
The number of applications awaiting a decision as of the end of the reporting period.
6
Represents the office location. The office location does not reflect the complete area covered by the office’s jurisdiction. Please refer to USCIS.gov for office jurisdictions.
NOTE: 1) Some applications approved, denied, or pending a decision may have been received in previous reporting periods.
2) The report reflects the most up-to-date estimate available at the time the report is generated.
Source: Department of Homeland Security, U.S. Citizenship and Immigration Services, Performance Reporting Tool , September 2016
ADVERTISEMENT
0 votes
Related Articles
Related forms


Related Categories
Parent category: Legal