Form 6-K - Report Of Foreign Private Issuer - District Of Columbia Securities And Exchange Commission - 2017 Page 15
ADVERTISEMENT
 1
1 2
2 3
3 4
4 5
5 6
6 7
7 8
8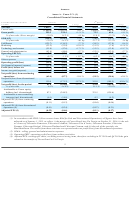 9
9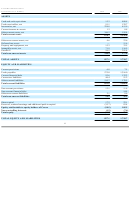 10
10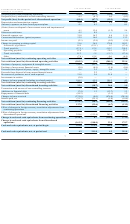 11
11 12
12 13
13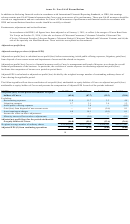 14
14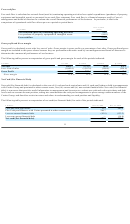 15
15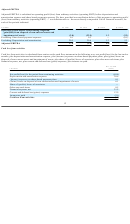 16
16Free cash flow
Free cash flow is calculated as net cash from/(used in) continuing operating activities less capital expenditures (purchases of property,
equipment and intangible assets) as presented in our cash flow statement. Free cash flow is a financial measure used by Cnova’s
management and board of directors to evaluate the overall financial performance of the business. In particular, it allows the
comparison of operational cash flow after capex on a period-to-period basis.
Dec. 31, 2016
€ millions
(LTM)
Net cash from/(used in) continuing operating activities
21.1
Less purchase of property, equipment & intangible assets
(44.0)
Free cash flow
(22.9)
Gross profit and Gross margin
Gross profit is calculated as net sales less cost of sales. Gross margin is gross profit as a percentage of net sales. Gross profit and gross
margin are included in this press release because they are performance measures used by our management and board of directors to
determine the commercial performance of our business.
The following tables present a computation of gross profit and gross margin for each of the periods indicated:
€ millions
FY 2016
FY 2015
Q4 2016
Q4 2015
Net sales
1,855.7
1,737.2
584.1
571.3
Less: Cost of sales
(1,600.4)
(1,507.8)
(508.8)
(501.8)
Gross Profit
255.3
229.4
75.3
69.4
Gross margin
13.8 %
13.2 %
12.9 %
12.2 %
Net Cash/(Net Financial Debt)
Net cash/(Net financial debt) is calculated as the sum of (i) cash and cash equivalents and (ii) cash pool balances held in arrangements
with Casino Group and presented in other current assets, less (iii) current and (iv) non-current financial debt. Net cash/(Net financial
debt) is a measure that provides useful information to management and investors to evaluate our cash and cash equivalents and debt
levels and our current account position, taking into consideration the cash pool arrangements in place among certain members of the
Casino Group, and therefore assists investors and others in understanding our cash position and liquidity.
The following table presents a computation of net cash/(net financial debt) for each of the periods indicated:
€ millions
Dec. 31, 2016
Dec. 31, 2015
Cash and cash equivalents
15.3
400.8
Plus Cash pool balances with Casino presented in other current assets
246.7
—
Less net current financial debt
(83.9)
(132.2)
Less non-current financial debt
—
(14.8)
Net cash/(Net financial debt)
178.1
253.8
11
ADVERTISEMENT
0 votes
Related Articles
Related forms
 Form 6-k - Report Of Foreign Private Issuer - District Of Columbia Securities And Exchange Commission - 2016
Business
Form 6-k - Report Of Foreign Private Issuer - District Of Columbia Securities And Exchange Commission - 2016
Business
 Form 6-k - Report Of Foreign Private Issuer - District Of Columbia Securities And Exchange Commission - 2016
Business
Form 6-k - Report Of Foreign Private Issuer - District Of Columbia Securities And Exchange Commission - 2016
Business
 Form 6-k - Report On Foreign Issuer - District Of Columbia Securities And Exchange Commission - 2015
Business
Form 6-k - Report On Foreign Issuer - District Of Columbia Securities And Exchange Commission - 2015
Business


")


Related Categories
Parent category: Business