Grades 6-8 Fcat 2.0 Mathematics Reference Sheet Page 19
ADVERTISEMENT
 1
1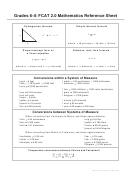 2
2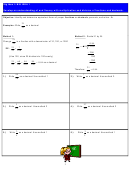 3
3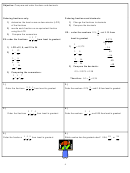 4
4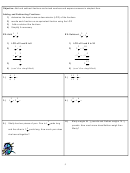 5
5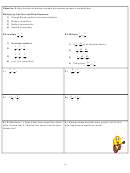 6
6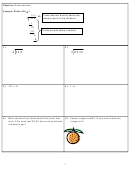 7
7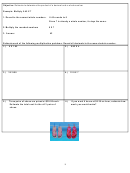 8
8 9
9 10
10 11
11 12
12 13
13 14
14 15
15 16
16 17
17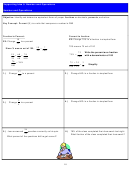 18
18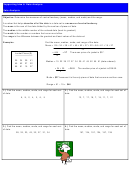 19
19 20
20Supporting Idea 6: Data Analysis
Data Analysis
Objective: Determine the measures of central tendency (mean, median, and mode) and the range.
A number that helps describe all of the data in a data set is a measure of central tendency.
The mean is the sum of the data divided by the number of pieces of data.
The median is the middle number of the ordered data (least to greatest.)
The mode is the number or numbers that occur most often.
The range is the difference between the greatest and least values of the data set.
Examples:
Find the mean, median, mode, and range of the data.
Mean = 25 + 34 + 39 + 41 + 45 + 52 + 27 + 22 + 56 + 61 + 15 + 27
12
= 444
= 37
The mean price of a jacket is $37.
Jacket Prices ($)
12
25 34 39 41
Median = 15 22 25 27 27 34 39 41 45 52 56 61 (data ordered)
45 52 27 22
56 61 15 27
= 34 + 39
= 36.5
The median price of a jacket is $36.50.
2
Mode = $27 because it is the only piece of data that occurs more than once.
Range = 61 – 15 = $46
1.) Find the mean, median, mode, and range for each set
2.) Find the mean, median, mode, and range for each set of
of data.
data.
6, 9, 2, 4, 3, 6, 5
13, 7, 17, 19, 7, 15, 11, 7, 21
3.) Find the mean, median, mode, and range for each set
4.) Find the mean, median, mode, and range for each set of
of data.
data.
28, 32, 23, 43, 32, 27, 21, 34
157, 124, 157, 124, 157, 139
19
ADVERTISEMENT
0 votes
Related Articles
Related forms


Related Categories
Parent category: Education