Life Science Multiple Choice Quiz Worksheet Page 8
ADVERTISEMENT
 1
1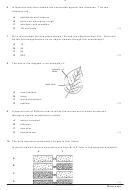 2
2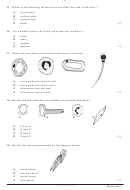 3
3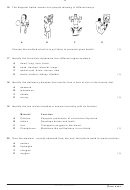 4
4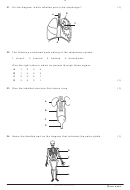 5
5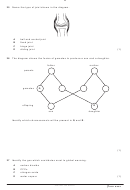 6
6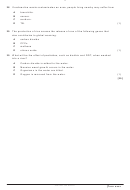 7
7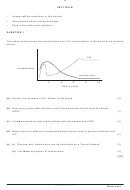 8
8 9
9 10
10 11
11 12
12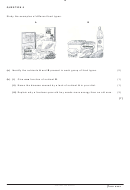 13
13 14
14 15
15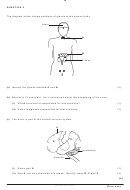 16
16 17
178
SECTION B
•
Answer all the questions in this section.
•
Use a pencil when making drawings.
•
Draw a line after each question.
QUESTION 1
The graph below shows the lymphocytes and HIV concentration in the blood of an infected
person.
HIV
concentration
lymphocytes
2
4
6
8
10
time in years
(a) Explain the increase of HIV shown in the graph.
(2)
(b) How many years after infection could this person be said to have full-blown
AIDS?
(1)
(c) List two symptoms that might indicate that the patient has AIDS.
(2)
(d) Name the most effective contraceptive that can be used to prevent infection with
HIV.
(1)
(e) (i) Discuss why tuberculosis can be described as a "social disease".
(3)
(ii) List three symptoms of tuberculosis.
(3)
[12]
[Turn over
JSC 2007, Life Science
ADVERTISEMENT
0 votes
Related Articles
Related forms


Related Categories
Parent category: Education