Edexcel Gcse Mathematics (Linear) - Cumulative Frequency Page 8
ADVERTISEMENT
 - Cumulative Frequency Printable pdf") 1
1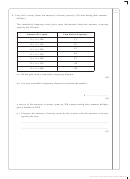 2
2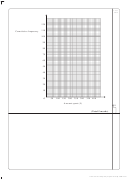 3
3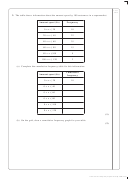 4
4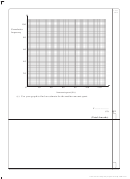 5
5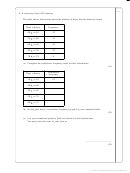 6
6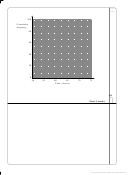 7
7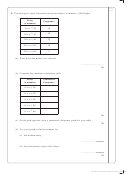 8
8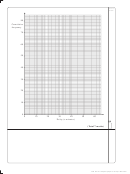 9
9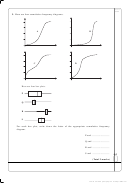 10
10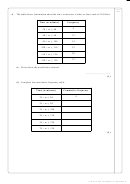 11
11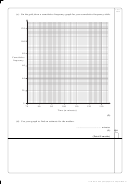 12
12Leave
blank
4. The table gives some information about the delays, in minutes, of 80 flights.
Delay
Frequency
(n minutes)
0 < n
20
16
26
20 < n
30
23
30 < n
40
40 < n
50
10
50 < n
60
5
(a) Write down the modal class interval.
.....................................
(1)
(b) Complete the cumulative frequency table.
Delay
Cumulative
(n minutes)
Frequency
0 < n
20
0 < n
30
0 < n
40
0 < n
50
0 < n
60
(1)
(c) On the grid opposite, draw a cumulative frequency graph for your table.
(2)
(d) Use your graph to find an estimate for
(i) the median delay,
........................ minutes
(ii) the interquartile range of the delays.
........................ minutes
(3)
Lots more free past papers at
ADVERTISEMENT
0 votes
Related Articles
Related forms
 - Surds")
 - Spheres And Cones")
 - Solvng Simultaneous Equations Graphically")
 - Simultaneous Equations With A Quadratic")
 - Simultaneous Equations")
 - Sine And Cosine Rules & Area Of Triangles")
 - Solving Quadratics By Factorising")
 - Fractions")
 - Compound Interest And Depreciation")
 - Angles")
Related Categories
Parent category: Education