Edexcel Gcse Mathematics (Linear) - Quadratic Graphs Page 2
ADVERTISEMENT
 - Quadratic Graphs Printable pdf") 1
1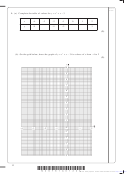 2
2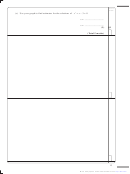 3
3 4
4 5
5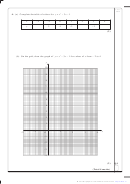 6
6 7
7 8
8Leave
blank
2
1. (a) Complete the table of values for y = x
+ x – 3
x
–4
–3
–2
–1
0
1
2
y
9
–1
–3
3
(2)
2
(b) On the grid below, draw the graph of y = x
+ x – 3 for values of x from –4 to 2
(2)
y
10
9
8
7
6
5
4
3
2
1
O
2 x
–4
–3
–2
–1
1
–1
–2
–3
–4
–5
12
*N36761A01224*
More free papers and model answers from
ADVERTISEMENT
0 votes
Related Articles
Related forms
 - Quadratic Equations")
 - Simultaneous Equations With A Quadratic")
 - Solving Quadratics By Factorising")
 - Algebra: Expand & Factorise Quadratics")
 - Surds")
 - Spheres And Cones")
 - Solvng Simultaneous Equations Graphically")
 - Simultaneous Equations")
 - Sine And Cosine Rules & Area Of Triangles")
 - Fractions")
Related Categories
Parent category: Education