Ibps Po Prelims Exam Template With Answers Page 14
ADVERTISEMENT
 1
1 2
2 3
3 4
4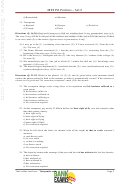 5
5 6
6 7
7 8
8 9
9 10
10 11
11 12
12 13
13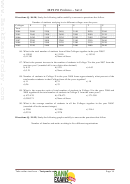 14
14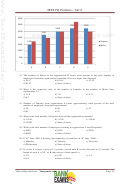 15
15 16
16 17
17 18
18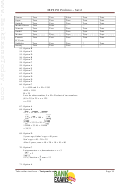 19
19 20
20 21
21 22
22IBPS PO Prelims – Set 2
Directions (Q. 86-90) Study the following table carefully to answer to questions that follow.
Number of students studying in six different colleges over the years
Colleges
P
Q
R
S
T
U
Year
2004
2500
2250
2450
2150
2020
2300
2005
2040
2300
2400
2200
2090
2120
2006
2100
2150
2330
2250
2180
2260
2007
2280
2600
2260
2340
2250
2490
2008
2540
2540
2120
2380
2310
2520
2009
2320
2440
2500
2480
2400
2440
86. What is the total number of students from all the Colleges together in the year 2005?
a) 10350
b) 13150
c) 15310
d) 11350
e) None of these
87. What is the percent increase in the number of students in College T in the year 2007 from the
previous year? (rounded off to two digits after decimal)
a) 8.33
b) 5.18
c) 6.63
d) 3.21
e) None of these
88. Number of students in College P in the year 2008 forms approximately what percent of the
total number students in that College from all the years together?
a) 11
b) 31
c) 18
d) 26
e) 23
89. What is the respective ratio of total number of students in College S in the years 2006 and
2009 together to the total number of students in College U from the same years?
a) 473:470
b) 470:473
c) 371:390
d) 390:371
e) None of these
90. What is the average number of students in all the Colleges together in the year 2004?
(rounded off to the nearest integer)
a) 2208
b) 2196
c) 2144
d) 2324
e) 2278
Directions (Q. 91-95) Study the following graph carefully to answer the questions that follow
Number of females and males working in five different organizations
Take online test here –
Page 14
ADVERTISEMENT
0 votes
Related Articles
Related forms


Related Categories
Parent category: Education