Linear Inequalities Worksheets Page 42
ADVERTISEMENT
 1
1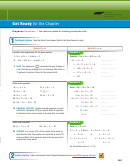 2
2 3
3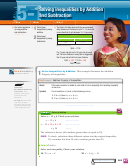 4
4 5
5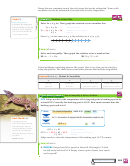 6
6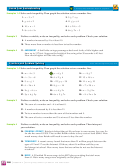 7
7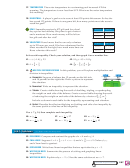 8
8 9
9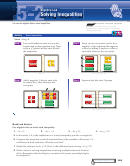 10
10 11
11 12
12 13
13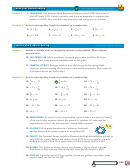 14
14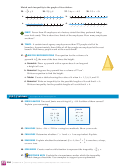 15
15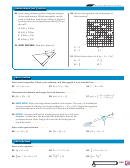 16
16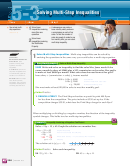 17
17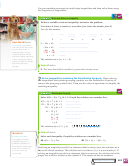 18
18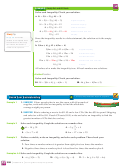 19
19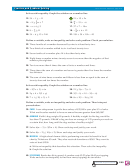 20
20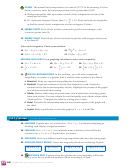 21
21 22
22 23
23 24
24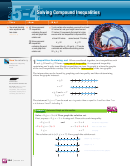 25
25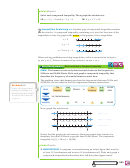 26
26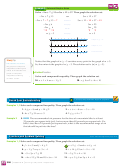 27
27 28
28 29
29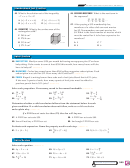 30
30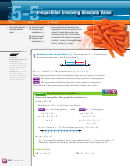 31
31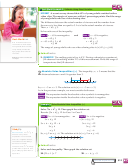 32
32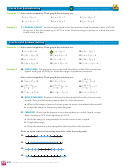 33
33 34
34 35
35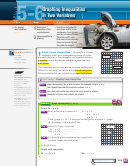 36
36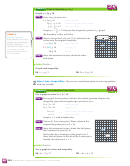 37
37 38
38 39
39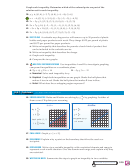 40
40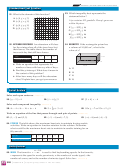 41
41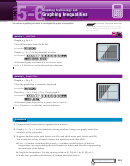 42
42 43
43 44
44 45
45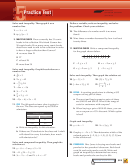 46
46 47
47 48
48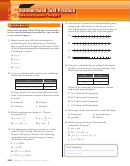 49
49 50
50Graphing Technology Lab
Graphing Technology Lab
Graphing Inequalities
Graphing Inequalities
You can use a graphing calculator to investigate the graphs of inequalities.
Tennessee Curriculum Standards
3102.3.26 Graph linear inequalities on the coordinate
plane and identify regions of the graph containing ordered
pairs in the solution.
Activity 1 Less Than
Graph y ≤ 2x + 5.
Clear all functions from the Y= list.
:
KEYSTROKES
Graph y ≤ 2x + 5 in the standard window.
: 2
5
KEYSTROKES
6
[ -10, 10 ] scl: 1 by [ -10, 10 ] scl: 1
All ordered pairs for which y is less than or equal
to 2x + 5 lie below or on the line and are solutions.
Activity 2 Greater Than
Graph y - 2x ≥ 5.
Clear the graph that is currently displayed.
:
KEYSTROKES
Rewrite y - 2x ≥ 5 as y ≥ 2x + 5 and graph it.
: 2
5
KEYSTROKES
6
[ -10, 10 ] scl: 1 by [ -10, 10 ] scl: 1
All ordered pairs for which y is greater than or equal to
2x + 5 lie above or on the line and are solutions.
Exercises
1. Compare and contrast the two graphs shown above.
2. Graph y ≥ -3x + 1 in the standard viewing window. Using your graph, name four
solutions of the inequality.
3. Suppose student water park tickets cost $16, and adult water park tickets cost $20.
You would like to buy at least 10 tickets but spend no more than $200.
a. Let x = number of student tickets and y = number of adult tickets. Write two
inequalities, one representing the total number of tickets and the other representing
the total cost of the tickets.
b. Graph the inequalities. Use the viewing window [0, 20] scl: 1 by [0, 20] scl: 1.
c. Name four possible combinations of student and adult tickets.
321
ADVERTISEMENT
0 votes
Related Articles
Related forms


Related Categories
Parent category: Education