Worksheet 2.5 - Rates Of Change And Particle Motion I Worksheet Page 7
ADVERTISEMENT
 1
1 2
2 3
3 4
4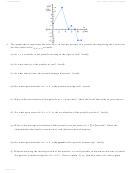 5
5 6
6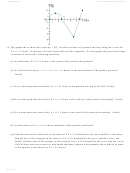 7
7 8
8Calculus Maximus
WS 2.5: Rates of Change & Part Mot I
( )
12. The graph above shows the velocity,
v t , in miles per hour of a particle moving along the x-axis for
t ≤ ≤
0
11
hours. It consists of a semi circle and two line segments. Use the graph and your knowledge
of motion to answer the following questions.
t ≤ ≤
(a) At what time, 0
hours, is the speed of the particle the greatest?
11
t = ,
t = , or
t =
(b) At which of the times,
hours, is the acceleration of the particle greatest?
2
6
9
Justify.
t < <
(c) Over what open time interval(s) 0
hours is the particle moving to the left? Justify.
11
t < <
(d) Over what open time interval(s) 0
11
hours is the velocity of the particle increasing? Justify.
t < <
(e) Over what open time interval(s) 0
11
hours is the speed of the particle increasing? Justify.
t < <
(f) At what times on 0
11
is the acceleration of the particle undefined?
t ≤ ≤
(g) Find the area of the semicircle on the interval 0
bounded by the curve and the x-axis, then
4
t ≤ ≤
find the area of the triangle on the interval 4
10
bounded by the curve and the x-axis, and
t ≤ ≤
finally, find the area of the triangle on the interval 10
11
bounded by the curve and the x-axis.
If all of these areas were positive and added together, propose what quantity this might be in terms
t ≤ ≤
of the particle’s movement on 0
hours.
11
Page 7 of 8
ADVERTISEMENT
0 votes
Related Articles
Related forms


 - Math Worksheet With Answer Key")
 - Math Worksheet With Answer Key")
 - Math Worksheet With Answer Key")
 - Math Worksheet With Answer Key")
 - Math Worksheet With Answer Key")
 - Math Worksheet With Answer Key")
 - Math Worksheet With Answer Key")
 - Math Worksheet With Answer Key")
Related Categories
Parent category: Education