Exponential Function Models Worksheet With Answers Page 2
ADVERTISEMENT
 1
1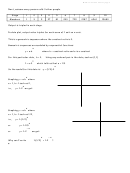 2
2 3
3 4
4 5
5 6
6 7
7Math 117 Lecture 9 notes page 2
Next, assume every person calls 3 other people.
Stage
1
2
3
4
5
6
7
8
9
10
Members
1
3
9
27
81
243
729
2187
6561
19683
Output is tripled in each stage.
In data plot, output value triples for each move of 1 unit on x-axis.
This is a geometric sequence where the constant ratio is 3.
Geometric sequences are modeled by exponential functions:
x
y = a•b
where b = constant ratio and a is a constant
For this particular data, b = 3.
Using any ordered pair in the data, such as (1,1)
1
1 = a•3
which tells us that a = 1/3
x
So the model for this data is: y = (1/3)•3
x
Graphing y = a•b
where
a = 1, b > 1 such as 2,
x
i.e.,
y = 1•2
we get:
x
Graphing y = a•b
where
a = 1, b < 1 such as 1/2,
x
i.e.,
y = 1•(1/2)
x
or
y = 1•0.5
– x
or
y = 1•2
we get:
x
– x
Why can I write
1•(1/2)
= 1•2
?
z
ADVERTISEMENT
0 votes
Related Articles
Related forms


Related Categories
Parent category: Education