Algebra I (Common Core) Practice Exam Worksheet With Scoring Key And Rating Guide - Mike Miller Page 10
ADVERTISEMENT
 Practice Exam Worksheet With Scoring Key And Rating Guide - Mike Miller Printable pdf") 1
1 2
2 3
3 4
4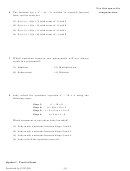 5
5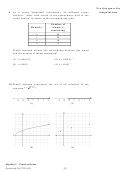 6
6 7
7 8
8 9
9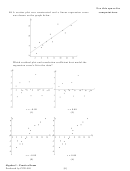 10
10 11
11 12
12 13
13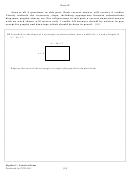 14
14 15
15 16
16 17
17 18
18 19
19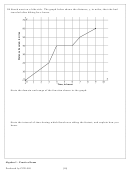 20
20 21
21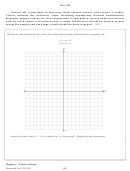 22
22 23
23 24
24 25
25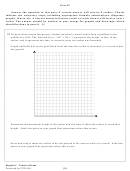 26
26 27
27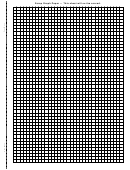 28
28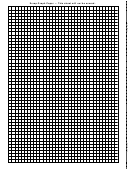 29
29 30
30 31
31 32
32 33
33 34
34 35
35 36
36 37
37 38
38 39
39 40
40Use this space for
18 A scatter plot was constructed and a linear regression curve
computations.
was drawn on the graph below.
Which residual plot and correlation coefficient best model the
regression curve’s fit to the data?
r = –0.95
r = 0.89
(1)
(3)
r = –0.95
r = 0.89
(2)
(4)
Algebra I – Practice Exam
[ 9 ]!
Produced by CFN 603
!
ADVERTISEMENT
0 votes
Related Articles
Related forms


Related Categories
Parent category: Education