Functions And Linear Modeling Worksheet With Answer Key Page 4
ADVERTISEMENT
 1
1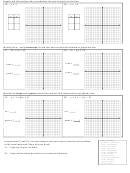 2
2 3
3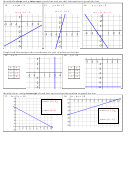 4
4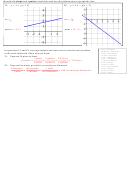 5
5Identify the slope and y-intercept of each line and use that information to graph the line.
5
5
12.
14.
13.
�� =
�� − 3
�� = −
�� − 2
�� = 4�� + 1
8
3
m = 4; b = 1.
5
5
m =
; b = −3.
m = −
; b = −2.
8
3
Graph each line and give the coordinates of a pair of points on the line.
15.
16.
�� = 3
�� = −6
x
y
x
y
3
1
0
‒6
3
‒2
3
‒6
3
0
‒1
‒6
Identify the x- and y-intercept of each line and use that information to graph the line.
17.
18.
3�� + 5�� = 30
2�� − 6�� = 24
x-int =
(10,
0);
x-int =
(12,
0);
y-int =
(0, 6).
y-int =
(0,
‒4).
ADVERTISEMENT
0 votes
Related Articles
Related forms


Related Categories
Parent category: Education