Measurement, Conversion, Comparison Math Worksheet With Answer Key
ADVERTISEMENT
 1
1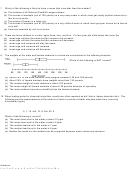 2
2Chapter 1 Review Questions
1. You measure the age, marital status and earned income of an SRS of 1463 women. The number and type of
variables you have measured is
(a) 1463; all quantitative.
(d) three; two categorical and one quantitative.
(b) four; two categorical and two quantitative.
(e) three; one categorical and two quantitative.
(c) four; one categorical and three quantitative.
2. Consumers’ Union measured the gas mileage in miles per gallon of 38
1978–1979 model automobiles on a special test track. The pie chart
below provides information about the country of manufacture of the
model cars used by Consumers Union. Based on the pie chart, we may
conclude that:
(a) Japanese cars get significantly lower gas mileage than cars of other
countries. This is
because their slice of the pie is at the bottom of the chart.
(b) U.S cars get significantly higher gas mileage than cars from other
countries.
(c) Swedish cars get gas mileages that are between those of Japanese
and U.S. cars.
(d) Mercedes, Audi, Porsche, and BMW represent approximately a
quarter of the cars tested.
(e) More than half of the cars in the study were from the United States.
3. A researcher reports that, on average, the participants in his study lost 10.4 pounds after two months on his new
diet. A friend of yours comments that she tried the diet for two months and lost no weight, so clearly the report
was a fraud. Which of the following statements is correct?
(a) Your friend must not have followed the diet correctly, since she did not lose weight.
(b) Since your friend did not lose weight, the report must not be correct.
(c) The report only gives the average. This does not imply that all participants in the study lost 10.4 pounds or
even that all lost weight. Your friend’s experience does not necessarily contradict the study results.
(d) In order for the study to be correct, we must now add your friend’s results to those of the study and
recompute the new average.
(e) Your friend is an outlier.
4. The following is an ogive on the number of ounces of alcohol (one ounce is about 30 mL) consumed per week in a
sample of 150 students.
A study wished to classify the students as “light”, “moderate”, “heavy”
and “problem” drinkers by the amount consumed per week. About what
percentage of students are moderate drinkers, that is consume between
4 and 8 ounces per week?
(a)
60%
(d)
80%
(b)
20%
(e)
50%
(c)
40%
5. “Normal” body temperature varies by time of day. A series of readings was taken of the body temperature of a
subject. The mean reading was found to be 36.5° C with a standard deviation of 0.3° C. When converted to °F,
the mean and standard deviation are
(°F = °C(1.8) + 32).
(a)
97.7, 32
(d)
97.7, 0.97
(b)
97.7, 0.30
(e)
97.7, 1.80
(c)
97.7, 0.54
6. The following is a histogram showing the actual frequency of the closing prices on the
New York exchange of a particular stock. Based on the frequency histogram for New
York Stock exchange, the class that contains the 80th percentile is:
(a)
20-30
(d)
50-60
(b)
10-20
(e)
30-40
(c)
40-50
ADVERTISEMENT
0 votes
Related Articles
Related forms


Related Categories
Parent category: Education