The Point-Slope Form Worksheet With Answer Key Page 7
ADVERTISEMENT
 1
1 2
2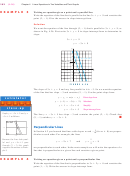 3
3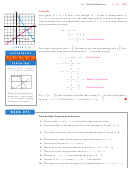 4
4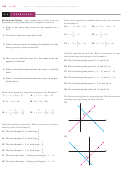 5
5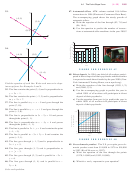 6
6 7
7196
(4–40)
Chapter 4 Linear Equations in Two Variables and Their Graphs
c) Graph the equation
G R A P H I N G C ALC U L ATO R
EXERCISES
52. Graph each equation on a graphing calculator. Choose a
viewing window that includes both the x- and y-
intercepts. Use the calculator output to help you draw
the graph on paper.
a) y
20x
300
b) y
30x
500
c) 2x
3y
6000
d) By how much is the gross domestic product increas-
ing per year?
e) Use your equation to predict the per capita gross do-
mestic product in the year 2000.
50. Body-mass index. The body mass index BMI is used to
assess the level of fat in a person’s body. When Tim
weighed 147 pounds his BMI was 23.4. When his
weight went to 185, his BMI was 29.5.
a) Find the equation of the line through (147, 23.4) and
(185, 29.5).
b) What do x and y represent in your equation?
c) Graph the equation.
d) Interpret the slope of this line.
53. Graph y
2x
1 and y
1.99x
1 on a graphing
calculator. Are these lines parallel? Explain your answer.
e) What is his BMI when his weight is 160?
54. Graph y
0.5x
0.8 and y
0.5x
0.7 on a graph-
GET TING MORE INVOLVED
ing calculator. Find a viewing window in which the two
lines are separate.
51. Exploration. What is the slope of the line 2x
3y
9?
What is the slope of 4x
5y
6? Write a formula for the
1
55. Graph y
3x
1 and y
x
2 on a graphing cal-
slope of Ax
By
C, where B
0.
3
culator. Do the lines look perpendicular? Explain.
ADVERTISEMENT
0 votes
Related Articles
Related forms


Related Categories
Parent category: Education