Algebraic Manipulation Worksheets With Answers - Craven Community College Page 19
ADVERTISEMENT
 1
1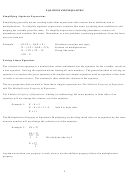 2
2 3
3 4
4 5
5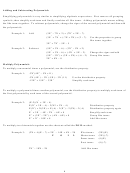 6
6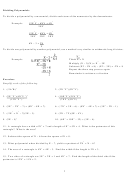 7
7 8
8 9
9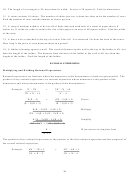 10
10 11
11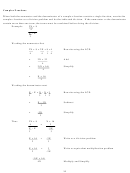 12
12 13
13 14
14 15
15 16
16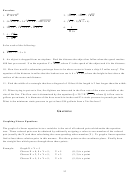 17
17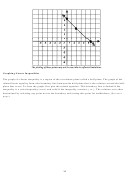 18
18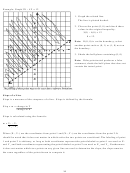 19
19 20
20 21
21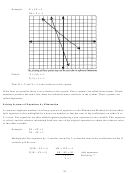 22
22 23
23 24
24 25
25 26
26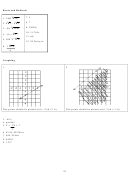 27
27 28
28 29
29Example: Graph 3X – 4Y < 12
1. Graph the related line.
The line is plotted dashed.
2. Choose the point (0, 0) and check these
values in the original inequality.
3(0) – 4(0) < 12
0 < 12.
Note: If (0, 0) is on the boundary, select
another point such as (0, 1) or (1, 0) not on
the boundary.
3. Shade the half-plane containing (0, 0)
Note: If the point tested produces a false
statement, shade the half-plane that does not
contain the tested point.
Slope of a Line
Slope is a measure of the steepness of a line. Slope is defined by the formula:
Slop = m = change in Y
change in X
Slope is calculated using the formula:
m = Y
– Y
2
1
X
– X
2
1
When (X
, Y
) are the coordinates from point 1 and (X
, Y
) are the coordinates from the point 2. It
1
1
2
2
should be noted that it does not matter in which order the two points are considered. The labeling of point
1 and point 2 is arbitrary, as long as both coordinates represent the point labeled as point 1 are used as X
1
and Y
and both coordinates representing the point labeled as point 2 are used as X
and Y
. Furthermore
1
2
2
it does not matter which two points on any given line are used to determine the slope, the slope remains
the same regardless of the point chosen to compute it.
19
ADVERTISEMENT
0 votes
Related Articles
Related forms


Related Categories
Parent category: Education