Mathematics 10c Unit 5 Student Worksheets With Answer Key Page 21
ADVERTISEMENT
 1
1 2
2 3
3 4
4 5
5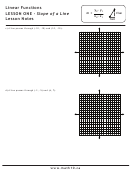 6
6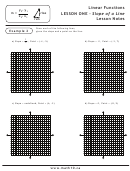 7
7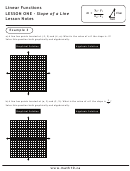 8
8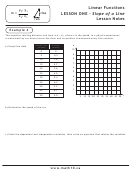 9
9 10
10 11
11 12
12 13
13 14
14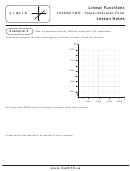 15
15 16
16 17
17 18
18 19
19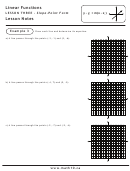 20
20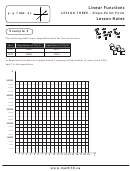 21
21 22
22 23
23 24
24 25
25 26
26 27
27 28
28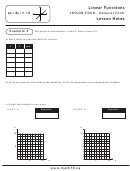 29
29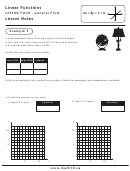 30
30 31
31 32
32 33
33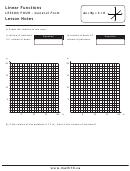 34
34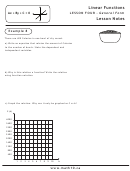 35
35 36
36 37
37 38
38 39
39 40
40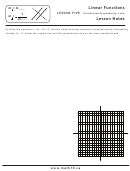 41
41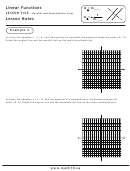 42
42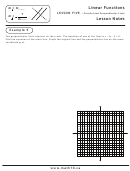 43
43 44
44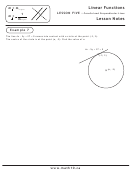 45
45 46
46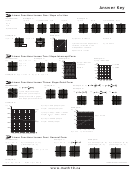 47
47 48
48Linear Functions
LESSON THREE - Slope-Point Form
y - y
= m(x - x
)
1
1
Lesson Notes
Example 4
The following table shows population data for two small cities.
Year
Population of City A
Population of City B
2012
34000
29170
2020
38960
27410
a) Represent this data on a graph where t represents the number of years since 2010
and P is the population.
P
50000
47500
45000
42500
40000
37500
35000
32500
30000
27500
25000
22500
20000
17500
15000
12500
10000
7500
5000
2500
1
2
3
4
5
6
7
8
9 10 11 12 13 14 15 16 17 18 19
t
ADVERTISEMENT
0 votes
Related Articles
Related forms

 Worksheet With Answer Key")
 Worksheet With Answer Key")
 Worksheet With Answer Key")
 Worksheet With Answer Key")
 Worksheet With Answer Key")
 Worksheet With Answer Key")
 Worksheet With Answer Key")


Related Categories
Parent category: Education