Ap Statistics Semester Exam Review Worksheets With Answer Key Page 8
ADVERTISEMENT
 1
1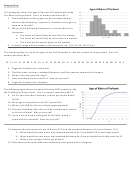 2
2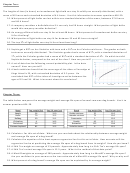 3
3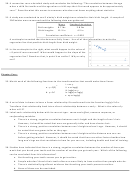 4
4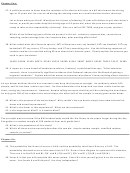 5
5 6
6 7
7 8
8 9
9Answers to AP Statistics Semester Exam Review:
1.
Skewed to the right
2.
b
3.
20-25
4.
Stemplot
5.
μ = 39.3; M = 37.5; σ = 23.52; five-number summary – (3 24 37.5 55 81)
6.
IQR = 31
7.
No, because 1.5xIQR yields a range from -22.5 to 101.5, and none of the data is outside of that range.
8.
Boxplot
th
9.
90
-percentile
10. 18 years old
11. 10
12. Yes, because 1.5xIQR is 15, and 55 is more than 15+Q
=40.
3
13. Skewed to the right, because most of the data is on the left side of the age axis.
14. a. μ = 65.8; σ = 12.2
b. μ = 279; σ = 61
c. 148.84
15. Bar graphs describe categorical data, while histograms describe quantitative data. In a bar graph, the bars do not touch,
while in a histogram, the bars are connected.
16. 68%
17. 0.0032
18. 0.0869
19. 0.6958
20. 71.02 hours
21. Calculus exam; her z-score for Statistics (1.14) was lower than her z-score for Calculus (1.5)
22. No, because the normal probability plot isn’t straight.
23. The data probably is not normal, as it is most likely skewed toward younger riders.
24. r = -0.849; there is a strong negative relationship between a dog breed’s average weight and average life span.
25. y = 13.8-0.027x; it will be pretty accurate, since the correlation is so strong.
26. 13.5 years
27. -1
28. 8.4 years; not very confident, since the Mastiff is far outside of our range of data.
29. 72.2%
30. There is no relationship between the age when a child first walks and the age when a child first says their first word. You
cannot predict one based off of the other.
31. y = 3.616+1.343x
32. r would most likely decrease, as the scatter would increase. The slope of the least-squares regression line would be
unaffected, as the line would follow a similar pattern. Point X is an outlier, as it affects the value of r.
33. a. ii
b. iv
5x
34. y = 100(10
); y=1,000
35. a. common response (girls tend to be shorter, and they also tend to have longer hair)
b. cause-and-effect (getting older causes you to grow taller)
c. confounding variables (there are other factors that contribute to how far you can run)
36. b
37. voluntary response bias, undercoverage bias, poor wording bias
38. I broke the numbers 1-100 into the following categories: 01-44 = football, 45-70 = baseball, 71-92 = basketball, 93-97 =
soccer, 98-99 = hockey, 00 = other. Then I created two-digit numbers from the random number sequence and came up
with the following results: 15 said football, 8 said baseball, 5 said basketball, 1 said soccer, and 1 said hockey
ADVERTISEMENT
0 votes
Related Articles
Related forms


 Mixed Review Worksheet With Answer Key")
 Mixed Review Worksheet With Answer Key")


Related Categories
Parent category: Education