Regents High School Examination - Integrated Algebra Worksheet - The University Of The State Of New York, 2010 Page 2
ADVERTISEMENT
 1
1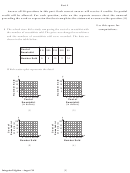 2
2 3
3 4
4 5
5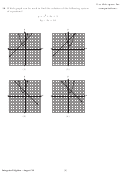 6
6 7
7 8
8 9
9 10
10 11
11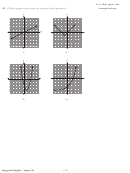 12
12 13
13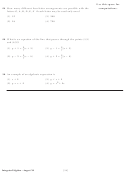 14
14 15
15 16
16 17
17 18
18 19
19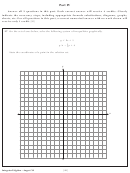 20
20 21
21 22
22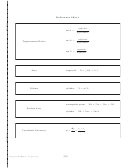 23
23 24
24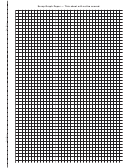 25
25 26
26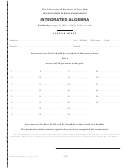 27
27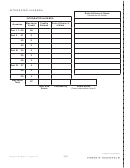 28
28Part I
Answer all 30 questions in this part. Each correct answer will receive 2 credits. No partial
credit will be allowed. For each question, write on the separate answer sheet the numeral
preceding the word or expression that best completes the statement or answers the question.
[60]
Use this space for
computations.
1 The school store did a study comparing the cost of a sweatshirt with
the number of sweatshirts sold. The price was changed several times
and the numbers of sweatshirts sold were recorded. The data are
shown in the table below.
Cost of
$10
$25
$15
$20
$5
Sweatshirt
Number Sold
9
6
15
11
14
Which scatter plot represents the data?
y
y
20
20
15
15
10
10
5
5
x
x
5 10 15 20 25
5 10 15 20 25
Cost of
Cost of
Sweatshirt
Sweatshirt
(in dollars)
(in dollars)
(1)
(3)
y
y
20
20
15
15
10
10
5
5
x
x
5 10 15 20 25
5 10 15 20 25
Number Sold
Number Sold
(2)
(4)
[2]
Integrated Algebra – August ’10
ADVERTISEMENT
0 votes
Related Articles
Related forms
 Regents High School Examination - Integrated Algebra Worksheet - The University Of The State Of New York, 2010
Education
Regents High School Examination - Integrated Algebra Worksheet - The University Of The State Of New York, 2010
Education
 Regents High School Examination - Integrated Algebra Worksheet - The University Of The State Of New York - 2009
Education
Regents High School Examination - Integrated Algebra Worksheet - The University Of The State Of New York - 2009
Education
 Regents High School Examination - Integrated Algebra Answers - The University Of The State Of New York, 2009
Education
Regents High School Examination - Integrated Algebra Answers - The University Of The State Of New York, 2009
Education
 Regents High School Examination - Mathematics B Worksheet - The University Of The State Of New York, 2004
Education
Regents High School Examination - Mathematics B Worksheet - The University Of The State Of New York, 2004
Education
 Regents High School Examination - Mathematics B Worksheet - The University Of The State Of New York, 2004
Education
Regents High School Examination - Mathematics B Worksheet - The University Of The State Of New York, 2004
Education
 Regents High School Examination - Mathematics B Worksheet - The University Of The State Of New York, 2009
Education
Regents High School Examination - Mathematics B Worksheet - The University Of The State Of New York, 2009
Education


Related Categories
Parent category: Education