Regents High School Examination - Integrated Algebra Worksheet - The University Of The State Of New York - 2009 Page 11
ADVERTISEMENT
 1
1 2
2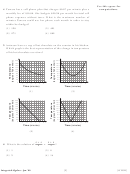 3
3 4
4 5
5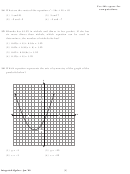 6
6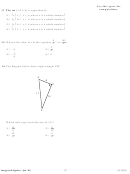 7
7 8
8 9
9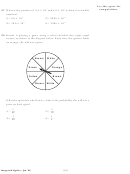 10
10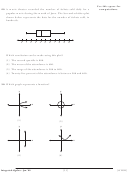 11
11 12
12 13
13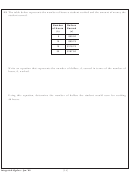 14
14 15
15 16
16 17
17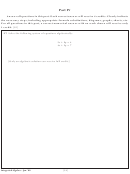 18
18 19
19 20
20 21
21 22
22 23
23 24
24 25
25 26
26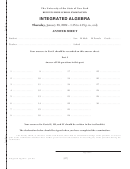 27
27 28
28Use this space for
computations.
29 A movie theater recorded the number of tickets sold daily for a
popular movie during the month of June. The box-and-whisker plot
shown below represents the data for the number of tickets sold, in
hundreds.
0
1
2
3
4
5
6
7
8
9
10
Which conclusion can be made using this plot?
(1) The second quartile is 600.
(2) The mean of the attendance is 400.
(3) The range of the attendance is 300 to 600.
(4) Twenty-five percent of the attendance is between 300 and 400.
30 Which graph represents a function?
y
y
x
x
(1)
(3)
y
y
x
x
(2)
(4)
[11]
[OVER]
Integrated Algebra – Jan. ’09
ADVERTISEMENT
0 votes
Related Articles
Related forms
 Regents High School Examination - Integrated Algebra Worksheet - The University Of The State Of New York, 2010
Education
Regents High School Examination - Integrated Algebra Worksheet - The University Of The State Of New York, 2010
Education
 Regents High School Examination - Integrated Algebra Worksheet - The University Of The State Of New York, 2010
Education
Regents High School Examination - Integrated Algebra Worksheet - The University Of The State Of New York, 2010
Education
 Regents High School Examination - Integrated Algebra Answers - The University Of The State Of New York, 2009
Education
Regents High School Examination - Integrated Algebra Answers - The University Of The State Of New York, 2009
Education
 Regents High School Examination - Mathematics B Worksheet - The University Of The State Of New York, 2009
Education
Regents High School Examination - Mathematics B Worksheet - The University Of The State Of New York, 2009
Education
 Regents High School Examination - Mathematics B Worksheet - The University Of The State Of New York, 2004
Education
Regents High School Examination - Mathematics B Worksheet - The University Of The State Of New York, 2004
Education
 Regents High School Examination - Mathematics B Worksheet - The University Of The State Of New York, 2004
Education
Regents High School Examination - Mathematics B Worksheet - The University Of The State Of New York, 2004
Education
 Regents High School Examination - Mathematics A Answers - The University Of The State Of New York - 2011
Education
Regents High School Examination - Mathematics A Answers - The University Of The State Of New York - 2011
Education


Related Categories
Parent category: Education