Regents High School Examination - Integrated Algebra Worksheet - The University Of The State Of New York, 2010 Page 10
ADVERTISEMENT
 1
1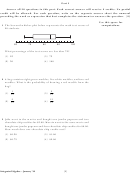 2
2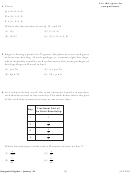 3
3 4
4 5
5 6
6 7
7 8
8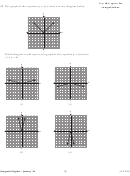 9
9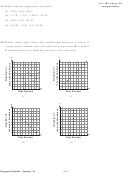 10
10 11
11 12
12 13
13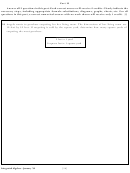 14
14 15
15 16
16 17
17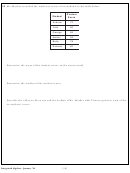 18
18 19
19 20
20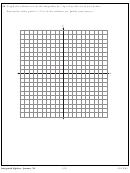 21
21 22
22 23
23 24
24 25
25 26
26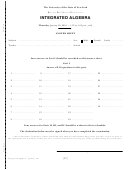 27
27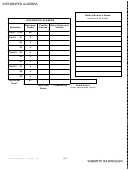 28
28Use this space for
18 Which relation represents a function?
computations.
(1) {(0,3), (2,4), (0,6)}
(2) {( − 7,5), ( − 7,1), ( − 10,3), ( − 4,3)}
(3) {(2,0), (6,2), (6, − 2)}
(4) {( − 6,5), ( − 3,2), (1,2), (6,5)}
19 Which scatter plot shows the relationship between x and y if
x represents a student score on a test and y represents the number
of incorrect answers a student received on the same test?
y
y
x
x
Test Scores
Test Scores
(3)
(1)
y
y
x
x
Test Scores
Test Scores
(4)
(2)
[10]
Integrated Algebra – January ’10
ADVERTISEMENT
0 votes
Related Articles
Related forms
 Regents High School Examination - Integrated Algebra Worksheet - The University Of The State Of New York, 2010
Education
Regents High School Examination - Integrated Algebra Worksheet - The University Of The State Of New York, 2010
Education
 Regents High School Examination - Integrated Algebra Worksheet - The University Of The State Of New York - 2009
Education
Regents High School Examination - Integrated Algebra Worksheet - The University Of The State Of New York - 2009
Education
 Regents High School Examination - Integrated Algebra Answers - The University Of The State Of New York, 2009
Education
Regents High School Examination - Integrated Algebra Answers - The University Of The State Of New York, 2009
Education
 Regents High School Examination - Mathematics B Worksheet - The University Of The State Of New York, 2004
Education
Regents High School Examination - Mathematics B Worksheet - The University Of The State Of New York, 2004
Education
 Regents High School Examination - Mathematics B Worksheet - The University Of The State Of New York, 2004
Education
Regents High School Examination - Mathematics B Worksheet - The University Of The State Of New York, 2004
Education
 Regents High School Examination - Mathematics B Worksheet - The University Of The State Of New York, 2009
Education
Regents High School Examination - Mathematics B Worksheet - The University Of The State Of New York, 2009
Education


Related Categories
Parent category: Education