Linear Functions Worksheet Page 27
ADVERTISEMENT
 1
1 2
2 3
3 4
4 5
5 6
6 7
7 8
8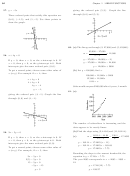 9
9 10
10 11
11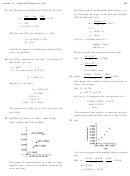 12
12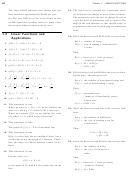 13
13 14
14 15
15 16
16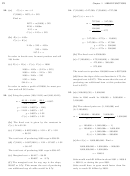 17
17 18
18 19
19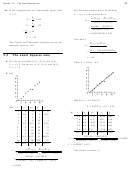 20
20 21
21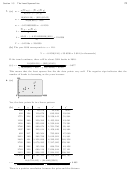 22
22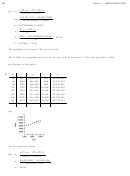 23
23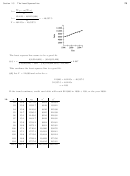 24
24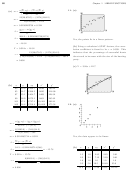 25
25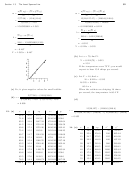 26
26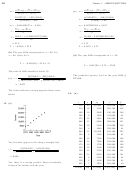 27
27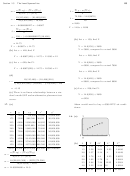 28
28 29
29 30
30 31
31 32
32 33
33 34
34 35
35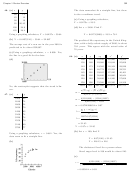 36
36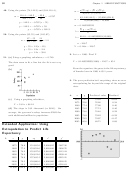 37
37 38
3882
Chapter 1 LINEAR FUNCTIONS
P
P
P
P
P
P
n(
xy) ¡ (
x)(
y)
n(
xy) ¡ (
x)(
y)
P
P
P
P
m =
(c) m =
n(
x
2
) ¡ (
x)
2
n(
x
2
) ¡ (
x)
2
10(5515:5) ¡ (305)(202:3)
8(2159:635) ¡ (140)(95:364)
m =
m =
10(12,025) ¡ 305
2
8(3500) ¡ 140
2
m = ¡0:240459137 ¼ ¡0:240
m = 0:4673952381 ¼ 0:467
P
P
P
P
y ¡ m(
x)
y ¡ m(
x)
b =
b =
n
n
202:9 ¡ (¡0:2428317077)(302)
95:364 ¡ 0:4673952381(140)
b =
b =
10
8
¼ 27:6
¼ 3:74
Y = ¡0:240x + 27:6
Y = 0:467x + 3:74
(b) The year 2010 corresponds to x = 60. Let
(d) The year 2020 corresponds to x = 50:
x = 60. Solve for Y:
Y = ¡0:243(60) + 27:6 ¼ 13
Y = 0:467(50) + 3:74 = 27:09
The ratio in 2010 should be about 13.
The predicted poverty level in the year 2020 is
10(5500:2) ¡ (302)(202:9)
p
p
(c) r =
$27,090.
10(11,704)¡302
2
¢
10(4277:07)¡202:9
2
¼ ¡0:975
The value indicates a strong negative linear corre-
16. (a)
lation.
2
2
x
y
xy
x
y
15. (a)
540
20
10; 800
400
291,600
510
16
8160
256
260,100
490
10
4900
100
240,100
560
8
4480
64
313,600
470
12
5640
144
220,900
600
11
6600
121
360,000
540
10
5400
100
291,600
580
8
4640
64
336,400
680
15
225
10,200
462,400
560
8
4480
64
313,600
560
13
7280
169
313,600
500
14
7000
196
250,000
Yes, the data appear to lie along a straight line.
470
10
4700
100
220,900
440
10
4400
100
8(2159:635) ¡ (140)(95:364)
193,600
p
p
r =
520
11
5720
121
270,400
2
2
8(3500)¡140
¢
8(1366:748)¡95:364
620
11
6820
121
384,400
¼ 0:999
680
8
5440
64
462,400
550
8
4400
64
302,500
Yes, there is a strong positive linear correlation
620
7
4340
49
384,400
between the income and the year.
210
2522
10,490
115,400
5,872,500
ADVERTISEMENT
0 votes
Related Articles
Related forms


Related Categories
Parent category: Education