Word Problem Worksheet
ADVERTISEMENT
 1
1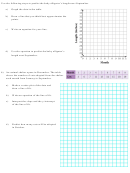 2
2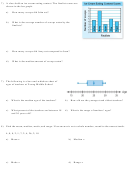 3
3 4
4 5
5Name_____________________________________ Date_________________________________
Chapter 9 Review
1) The scatter plot shows the number of geese that migrated to a park
each season.
a)
In what year did 270 geese migrate?
b)
How many geese migrated in 2010?
c)
Describe the relationship shown by the data.
Describe the relationship between the data. Identify any outliers, gaps, or clusters.
2)
3)
4)
5)
You have been working on a science project for 8 months. Each month, you measured the length of a baby
alligator. The following table shows your measurements.
ADVERTISEMENT
0 votes
Related Articles
Related forms


Related Categories
Parent category: Education