Algebra 2 Pre-Ap Test Review 3.1-3.3 Woeksheet With Answers Page 4
ADVERTISEMENT
 1
1 2
2 3
3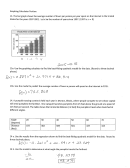 4
4Graphing Calculator Portion:
13. The bar graph shows the average number of hours per person per year spent on the Internet in the United
States for the years 1997-2001. Let x be the number of years since 1997. (1997 is x = 0)
13a. Use the graphing calculator to find the best-fitting quadratic model for the data. (Round to three decimal
places.)
13b. Use the model to predict the average number of hours a person will spend on the Internet in 2015.
14. A pumpkin tossing contest is held each year in Morton, Illinois, where people compete to see whose capital
will send pumpkins the farthest° One catapult launches pumpkins from 25 feet above the ground at a speed of
125 feet per second. The table shows the horizontal distance ( in feet) the pumpkins travel when launched at
different angles.
Angle
20
30
40
50
60
70
(degrees)
Distance
372
462
509
501
437
323
(feet)
14 a. Use the results from the regression shown to find the best-fitting quadratic model for the data. Round to
three decimal places.
14 b. Use the model to determine at what angle the pumpkin travels the farthest.
ADVERTISEMENT
0 votes
Related Articles
Related forms


 - Fall 2009")


Related Categories
Parent category: Education